Native Hawaiian vs Ugandan Births to Unmarried Women
COMPARE
Native Hawaiian
Ugandan
Births to Unmarried Women
Births to Unmarried Women Comparison
Native Hawaiians
Ugandans
34.3%
BIRTHS TO UNMARRIED WOMEN
2.9/ 100
METRIC RATING
231st/ 347
METRIC RANK
30.1%
BIRTHS TO UNMARRIED WOMEN
89.2/ 100
METRIC RATING
120th/ 347
METRIC RANK
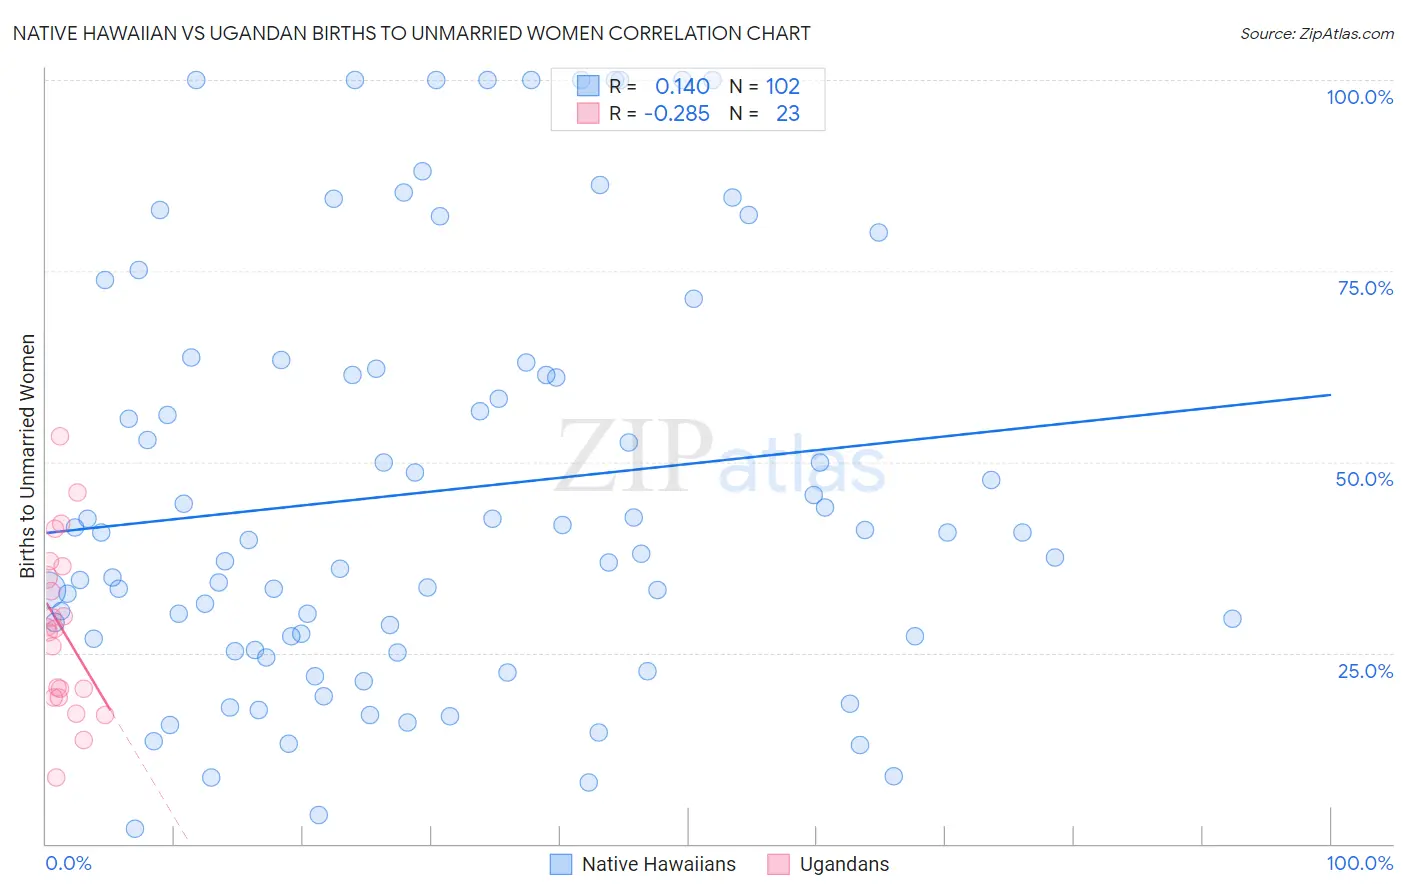
Native Hawaiian vs Ugandan Births to Unmarried Women Correlation Chart
The statistical analysis conducted on geographies consisting of 315,286,073 people shows a poor positive correlation between the proportion of Native Hawaiians and percentage of births to unmarried women in the United States with a correlation coefficient (R) of 0.140 and weighted average of 34.3%. Similarly, the statistical analysis conducted on geographies consisting of 92,593,945 people shows a weak negative correlation between the proportion of Ugandans and percentage of births to unmarried women in the United States with a correlation coefficient (R) of -0.285 and weighted average of 30.1%, a difference of 14.0%.
Births to Unmarried Women Correlation Summary
| Measurement | Native Hawaiian | Ugandan |
| Minimum | 1.9% | 8.7% |
| Maximum | 100.0% | 53.4% |
| Range | 98.1% | 44.7% |
| Mean | 46.1% | 28.2% |
| Median | 40.2% | 28.1% |
| Interquartile 25% (IQ1) | 26.8% | 19.1% |
| Interquartile 75% (IQ3) | 62.2% | 36.4% |
| Interquartile Range (IQR) | 35.4% | 17.3% |
| Standard Deviation (Sample) | 27.3% | 11.1% |
| Standard Deviation (Population) | 27.1% | 10.9% |
Similar Demographics by Births to Unmarried Women
Demographics Similar to Native Hawaiians by Births to Unmarried Women
In terms of births to unmarried women, the demographic groups most similar to Native Hawaiians are Ghanaian (34.3%, a difference of 0.14%), Immigrants from Sierra Leone (34.2%, a difference of 0.17%), Panamanian (34.2%, a difference of 0.28%), French Canadian (34.4%, a difference of 0.30%), and Immigrants from Panama (34.2%, a difference of 0.31%).
| Demographics | Rating | Rank | Births to Unmarried Women |
| Immigrants | Laos | 4.3 /100 | #224 | Tragic 34.0% |
| Spanish | 4.0 /100 | #225 | Tragic 34.1% |
| Delaware | 3.3 /100 | #226 | Tragic 34.2% |
| Immigrants | Panama | 3.3 /100 | #227 | Tragic 34.2% |
| Panamanians | 3.3 /100 | #228 | Tragic 34.2% |
| Immigrants | Sierra Leone | 3.1 /100 | #229 | Tragic 34.2% |
| Ghanaians | 3.1 /100 | #230 | Tragic 34.3% |
| Native Hawaiians | 2.9 /100 | #231 | Tragic 34.3% |
| French Canadians | 2.5 /100 | #232 | Tragic 34.4% |
| Bangladeshis | 2.5 /100 | #233 | Tragic 34.4% |
| Immigrants | Zaire | 2.3 /100 | #234 | Tragic 34.5% |
| Immigrants | Ghana | 2.2 /100 | #235 | Tragic 34.5% |
| Immigrants | Cameroon | 1.6 /100 | #236 | Tragic 34.7% |
| Marshallese | 1.6 /100 | #237 | Tragic 34.8% |
| Immigrants | Cambodia | 1.6 /100 | #238 | Tragic 34.8% |
Demographics Similar to Ugandans by Births to Unmarried Women
In terms of births to unmarried women, the demographic groups most similar to Ugandans are Korean (30.1%, a difference of 0.070%), Immigrants from Argentina (30.1%, a difference of 0.12%), Syrian (30.2%, a difference of 0.25%), Croatian (30.2%, a difference of 0.29%), and Argentinean (30.0%, a difference of 0.36%).
| Demographics | Rating | Rank | Births to Unmarried Women |
| Scandinavians | 92.7 /100 | #113 | Exceptional 29.8% |
| Immigrants | Croatia | 92.6 /100 | #114 | Exceptional 29.8% |
| Ethiopians | 91.9 /100 | #115 | Exceptional 29.8% |
| Immigrants | Italy | 91.7 /100 | #116 | Exceptional 29.9% |
| Immigrants | Netherlands | 91.1 /100 | #117 | Exceptional 29.9% |
| Immigrants | Norway | 91.0 /100 | #118 | Exceptional 29.9% |
| Argentineans | 90.5 /100 | #119 | Exceptional 30.0% |
| Ugandans | 89.2 /100 | #120 | Excellent 30.1% |
| Koreans | 88.9 /100 | #121 | Excellent 30.1% |
| Immigrants | Argentina | 88.7 /100 | #122 | Excellent 30.1% |
| Syrians | 88.2 /100 | #123 | Excellent 30.2% |
| Croatians | 88.0 /100 | #124 | Excellent 30.2% |
| Vietnamese | 87.7 /100 | #125 | Excellent 30.2% |
| Europeans | 87.2 /100 | #126 | Excellent 30.2% |
| Chinese | 87.1 /100 | #127 | Excellent 30.2% |