Trinidadian and Tobagonian vs Ugandan Births to Unmarried Women
COMPARE
Trinidadian and Tobagonian
Ugandan
Births to Unmarried Women
Births to Unmarried Women Comparison
Trinidadians and Tobagonians
Ugandans
36.5%
BIRTHS TO UNMARRIED WOMEN
0.2/ 100
METRIC RATING
261st/ 347
METRIC RANK
30.1%
BIRTHS TO UNMARRIED WOMEN
89.2/ 100
METRIC RATING
120th/ 347
METRIC RANK
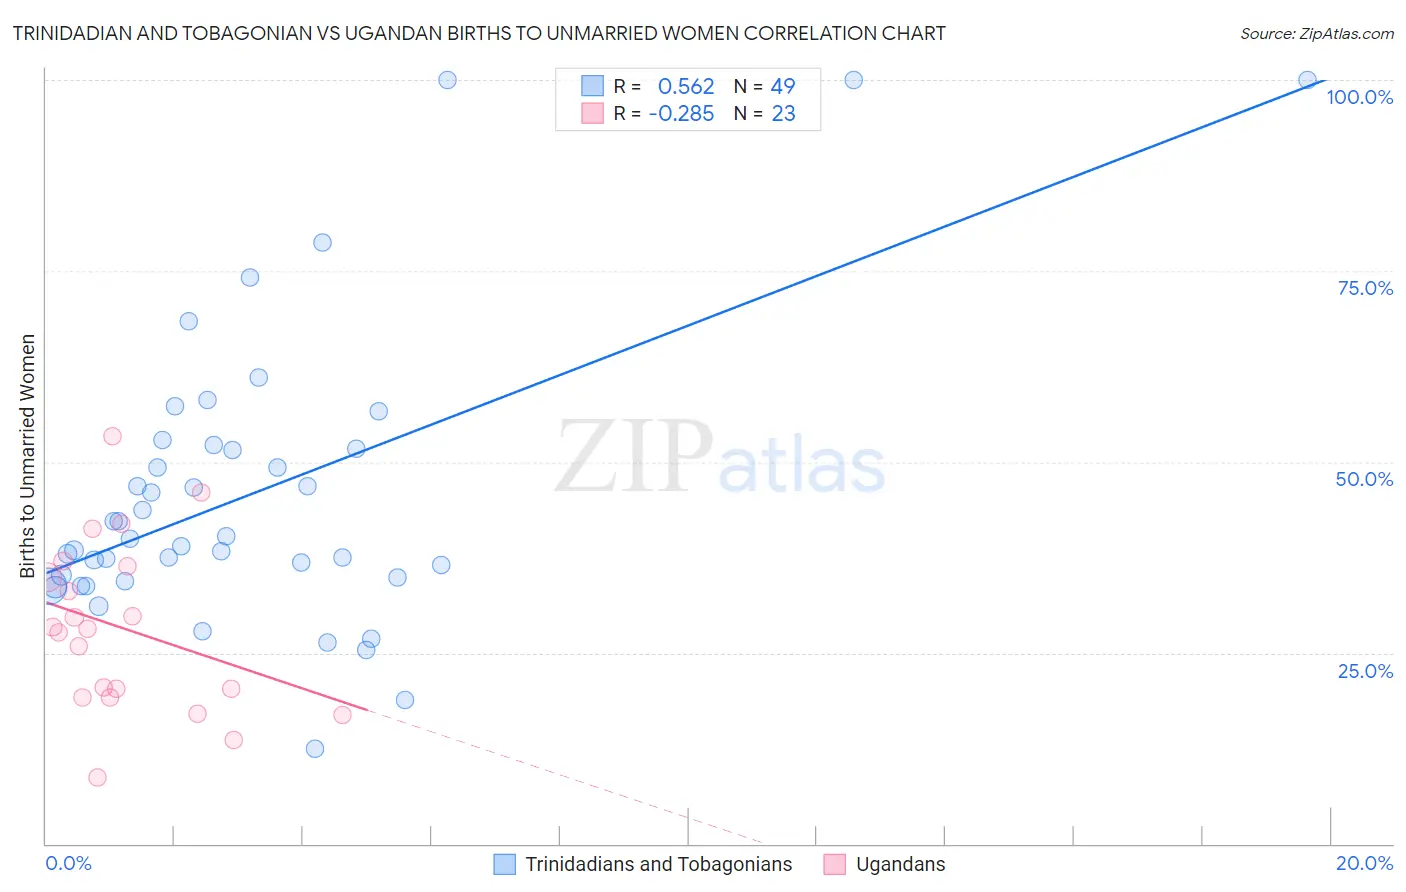
Trinidadian and Tobagonian vs Ugandan Births to Unmarried Women Correlation Chart
The statistical analysis conducted on geographies consisting of 212,407,546 people shows a substantial positive correlation between the proportion of Trinidadians and Tobagonians and percentage of births to unmarried women in the United States with a correlation coefficient (R) of 0.562 and weighted average of 36.5%. Similarly, the statistical analysis conducted on geographies consisting of 92,593,945 people shows a weak negative correlation between the proportion of Ugandans and percentage of births to unmarried women in the United States with a correlation coefficient (R) of -0.285 and weighted average of 30.1%, a difference of 21.2%.
Births to Unmarried Women Correlation Summary
| Measurement | Trinidadian and Tobagonian | Ugandan |
| Minimum | 12.5% | 8.7% |
| Maximum | 100.0% | 53.4% |
| Range | 87.5% | 44.7% |
| Mean | 45.7% | 28.2% |
| Median | 39.9% | 28.1% |
| Interquartile 25% (IQ1) | 34.6% | 19.1% |
| Interquartile 75% (IQ3) | 52.0% | 36.4% |
| Interquartile Range (IQR) | 17.4% | 17.3% |
| Standard Deviation (Sample) | 19.0% | 11.1% |
| Standard Deviation (Population) | 18.8% | 10.9% |
Similar Demographics by Births to Unmarried Women
Demographics Similar to Trinidadians and Tobagonians by Births to Unmarried Women
In terms of births to unmarried women, the demographic groups most similar to Trinidadians and Tobagonians are Ottawa (36.5%, a difference of 0.0%), Immigrants from El Salvador (36.4%, a difference of 0.12%), American (36.4%, a difference of 0.17%), French American Indian (36.6%, a difference of 0.37%), and Nicaraguan (36.6%, a difference of 0.38%).
| Demographics | Rating | Rank | Births to Unmarried Women |
| Potawatomi | 0.2 /100 | #254 | Tragic 36.2% |
| Chickasaw | 0.2 /100 | #255 | Tragic 36.3% |
| Immigrants | Trinidad and Tobago | 0.2 /100 | #256 | Tragic 36.3% |
| Immigrants | Grenada | 0.2 /100 | #257 | Tragic 36.3% |
| Americans | 0.2 /100 | #258 | Tragic 36.4% |
| Immigrants | El Salvador | 0.2 /100 | #259 | Tragic 36.4% |
| Ottawa | 0.2 /100 | #260 | Tragic 36.5% |
| Trinidadians and Tobagonians | 0.2 /100 | #261 | Tragic 36.5% |
| French American Indians | 0.1 /100 | #262 | Tragic 36.6% |
| Nicaraguans | 0.1 /100 | #263 | Tragic 36.6% |
| Sub-Saharan Africans | 0.1 /100 | #264 | Tragic 36.7% |
| Cherokee | 0.1 /100 | #265 | Tragic 36.7% |
| Immigrants | Senegal | 0.1 /100 | #266 | Tragic 36.7% |
| Central Americans | 0.1 /100 | #267 | Tragic 36.7% |
| Comanche | 0.1 /100 | #268 | Tragic 36.7% |
Demographics Similar to Ugandans by Births to Unmarried Women
In terms of births to unmarried women, the demographic groups most similar to Ugandans are Korean (30.1%, a difference of 0.070%), Immigrants from Argentina (30.1%, a difference of 0.12%), Syrian (30.2%, a difference of 0.25%), Croatian (30.2%, a difference of 0.29%), and Argentinean (30.0%, a difference of 0.36%).
| Demographics | Rating | Rank | Births to Unmarried Women |
| Scandinavians | 92.7 /100 | #113 | Exceptional 29.8% |
| Immigrants | Croatia | 92.6 /100 | #114 | Exceptional 29.8% |
| Ethiopians | 91.9 /100 | #115 | Exceptional 29.8% |
| Immigrants | Italy | 91.7 /100 | #116 | Exceptional 29.9% |
| Immigrants | Netherlands | 91.1 /100 | #117 | Exceptional 29.9% |
| Immigrants | Norway | 91.0 /100 | #118 | Exceptional 29.9% |
| Argentineans | 90.5 /100 | #119 | Exceptional 30.0% |
| Ugandans | 89.2 /100 | #120 | Excellent 30.1% |
| Koreans | 88.9 /100 | #121 | Excellent 30.1% |
| Immigrants | Argentina | 88.7 /100 | #122 | Excellent 30.1% |
| Syrians | 88.2 /100 | #123 | Excellent 30.2% |
| Croatians | 88.0 /100 | #124 | Excellent 30.2% |
| Vietnamese | 87.7 /100 | #125 | Excellent 30.2% |
| Europeans | 87.2 /100 | #126 | Excellent 30.2% |
| Chinese | 87.1 /100 | #127 | Excellent 30.2% |