Iraqi vs Immigrants from Moldova College, 1 year or more
COMPARE
Iraqi
Immigrants from Moldova
College, 1 year or more
College, 1 year or more Comparison
Iraqis
Immigrants from Moldova
60.7%
COLLEGE, 1 YEAR OR MORE
83.3/ 100
METRIC RATING
140th/ 347
METRIC RANK
63.0%
COLLEGE, 1 YEAR OR MORE
99.0/ 100
METRIC RATING
73rd/ 347
METRIC RANK
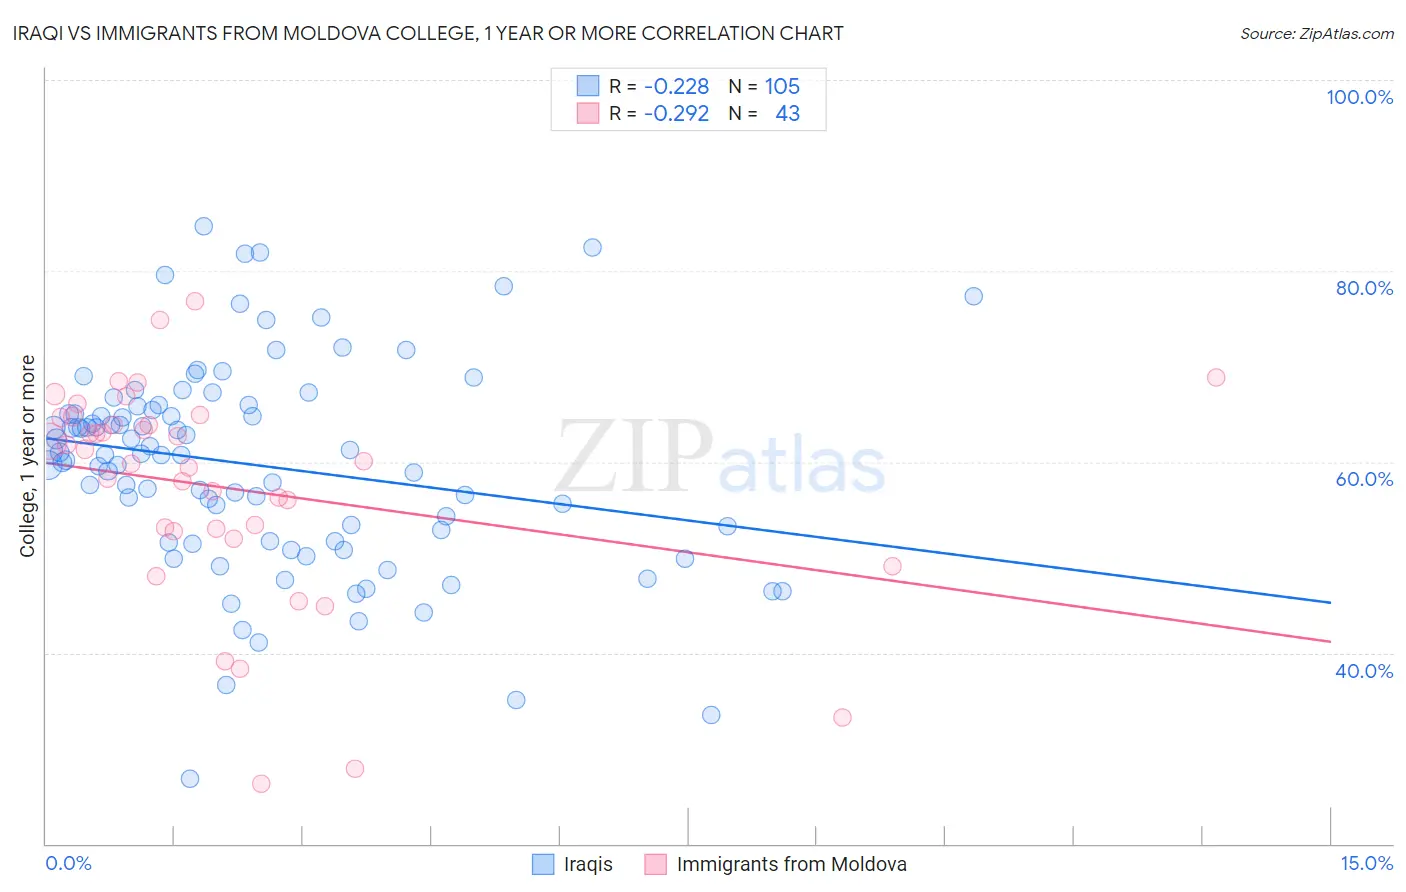
Iraqi vs Immigrants from Moldova College, 1 year or more Correlation Chart
The statistical analysis conducted on geographies consisting of 170,654,197 people shows a weak negative correlation between the proportion of Iraqis and percentage of population with at least college, 1 year or more education in the United States with a correlation coefficient (R) of -0.228 and weighted average of 60.7%. Similarly, the statistical analysis conducted on geographies consisting of 124,398,509 people shows a weak negative correlation between the proportion of Immigrants from Moldova and percentage of population with at least college, 1 year or more education in the United States with a correlation coefficient (R) of -0.292 and weighted average of 63.0%, a difference of 3.9%.
College, 1 year or more Correlation Summary
| Measurement | Iraqi | Immigrants from Moldova |
| Minimum | 26.8% | 26.3% |
| Maximum | 84.7% | 76.8% |
| Range | 57.8% | 50.4% |
| Mean | 59.6% | 57.2% |
| Median | 60.8% | 60.0% |
| Interquartile 25% (IQ1) | 51.7% | 52.7% |
| Interquartile 75% (IQ3) | 65.6% | 64.6% |
| Interquartile Range (IQR) | 13.9% | 12.0% |
| Standard Deviation (Sample) | 10.9% | 11.4% |
| Standard Deviation (Population) | 10.8% | 11.3% |
Similar Demographics by College, 1 year or more
Demographics Similar to Iraqis by College, 1 year or more
In terms of college, 1 year or more, the demographic groups most similar to Iraqis are Immigrants from Afghanistan (60.7%, a difference of 0.020%), Polish (60.7%, a difference of 0.050%), Canadian (60.6%, a difference of 0.050%), Immigrants from Eritrea (60.7%, a difference of 0.090%), and Taiwanese (60.7%, a difference of 0.10%).
| Demographics | Rating | Rank | College, 1 year or more |
| Immigrants | Uzbekistan | 88.0 /100 | #133 | Excellent 61.0% |
| Immigrants | Venezuela | 87.9 /100 | #134 | Excellent 61.0% |
| Immigrants | Uganda | 87.4 /100 | #135 | Excellent 60.9% |
| Basques | 87.2 /100 | #136 | Excellent 60.9% |
| Slovenes | 86.5 /100 | #137 | Excellent 60.9% |
| Taiwanese | 84.3 /100 | #138 | Excellent 60.7% |
| Immigrants | Eritrea | 84.3 /100 | #139 | Excellent 60.7% |
| Iraqis | 83.3 /100 | #140 | Excellent 60.7% |
| Immigrants | Afghanistan | 83.1 /100 | #141 | Excellent 60.7% |
| Poles | 82.8 /100 | #142 | Excellent 60.7% |
| Canadians | 82.7 /100 | #143 | Excellent 60.6% |
| Czechs | 81.9 /100 | #144 | Excellent 60.6% |
| Slavs | 81.1 /100 | #145 | Excellent 60.6% |
| Scottish | 80.2 /100 | #146 | Excellent 60.5% |
| Immigrants | Kenya | 79.1 /100 | #147 | Good 60.5% |
Demographics Similar to Immigrants from Moldova by College, 1 year or more
In terms of college, 1 year or more, the demographic groups most similar to Immigrants from Moldova are Egyptian (63.1%, a difference of 0.010%), Immigrants from North America (63.0%, a difference of 0.020%), Immigrants from Canada (63.1%, a difference of 0.070%), Armenian (63.0%, a difference of 0.11%), and Paraguayan (62.9%, a difference of 0.21%).
| Demographics | Rating | Rank | College, 1 year or more |
| Immigrants | Europe | 99.3 /100 | #66 | Exceptional 63.3% |
| Immigrants | Romania | 99.3 /100 | #67 | Exceptional 63.3% |
| Immigrants | Greece | 99.3 /100 | #68 | Exceptional 63.3% |
| Immigrants | Zimbabwe | 99.3 /100 | #69 | Exceptional 63.3% |
| Argentineans | 99.2 /100 | #70 | Exceptional 63.2% |
| Immigrants | Canada | 99.1 /100 | #71 | Exceptional 63.1% |
| Egyptians | 99.0 /100 | #72 | Exceptional 63.1% |
| Immigrants | Moldova | 99.0 /100 | #73 | Exceptional 63.0% |
| Immigrants | North America | 99.0 /100 | #74 | Exceptional 63.0% |
| Armenians | 98.9 /100 | #75 | Exceptional 63.0% |
| Paraguayans | 98.8 /100 | #76 | Exceptional 62.9% |
| Ethiopians | 98.8 /100 | #77 | Exceptional 62.9% |
| Immigrants | Lebanon | 98.8 /100 | #78 | Exceptional 62.9% |
| Northern Europeans | 98.8 /100 | #79 | Exceptional 62.9% |
| Lithuanians | 98.8 /100 | #80 | Exceptional 62.9% |