Bangladeshi vs Navajo College, 1 year or more
COMPARE
Bangladeshi
Navajo
College, 1 year or more
College, 1 year or more Comparison
Bangladeshis
Navajo
54.5%
COLLEGE, 1 YEAR OR MORE
0.2/ 100
METRIC RATING
269th/ 347
METRIC RANK
50.8%
COLLEGE, 1 YEAR OR MORE
0.0/ 100
METRIC RATING
322nd/ 347
METRIC RANK
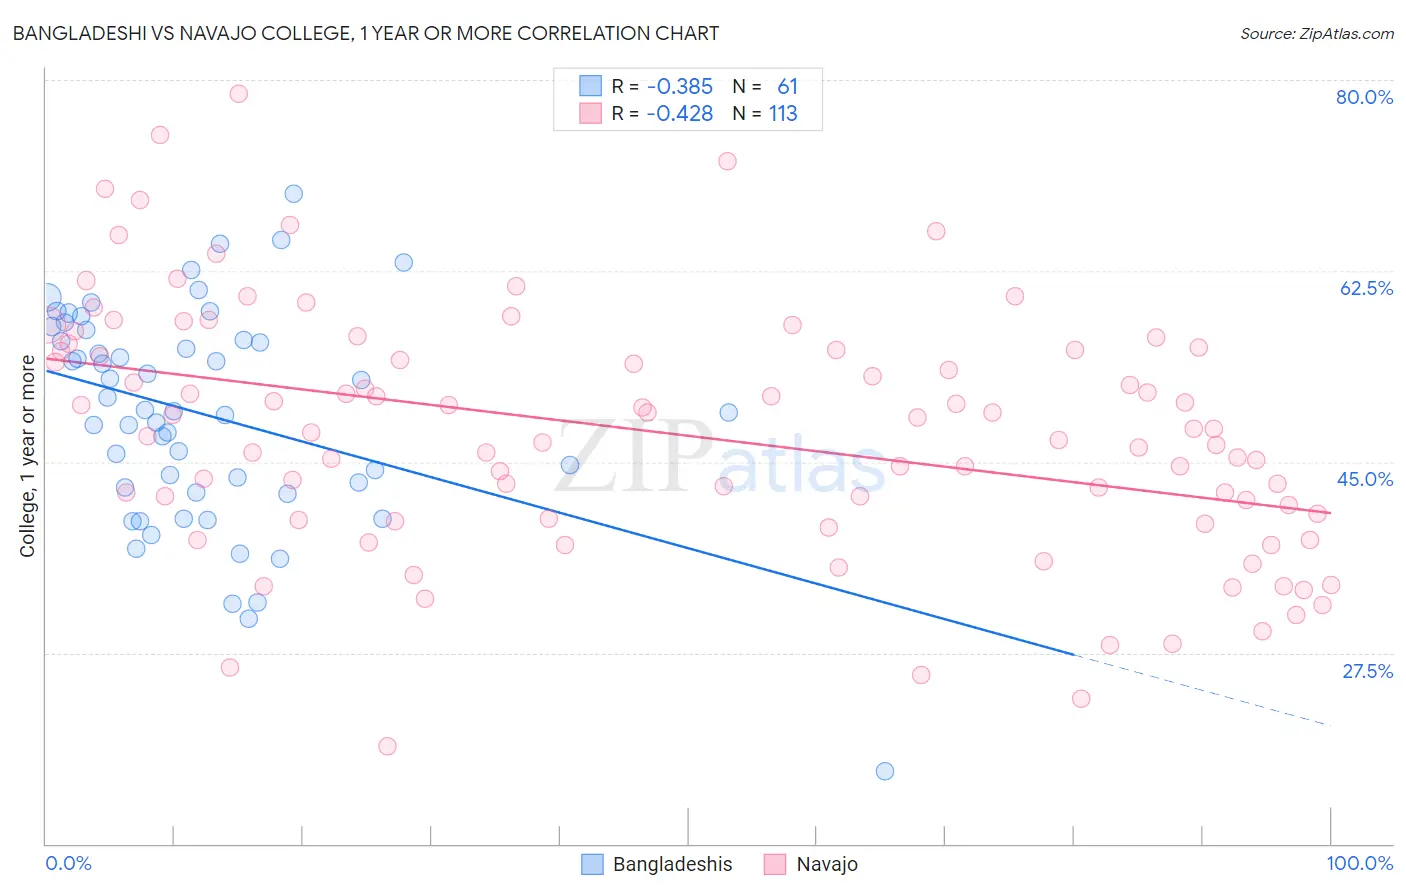
Bangladeshi vs Navajo College, 1 year or more Correlation Chart
The statistical analysis conducted on geographies consisting of 141,449,898 people shows a mild negative correlation between the proportion of Bangladeshis and percentage of population with at least college, 1 year or more education in the United States with a correlation coefficient (R) of -0.385 and weighted average of 54.5%. Similarly, the statistical analysis conducted on geographies consisting of 224,872,239 people shows a moderate negative correlation between the proportion of Navajo and percentage of population with at least college, 1 year or more education in the United States with a correlation coefficient (R) of -0.428 and weighted average of 50.8%, a difference of 7.3%.
College, 1 year or more Correlation Summary
| Measurement | Bangladeshi | Navajo |
| Minimum | 16.7% | 18.9% |
| Maximum | 69.6% | 78.7% |
| Range | 52.9% | 59.8% |
| Mean | 49.3% | 47.6% |
| Median | 49.6% | 47.7% |
| Interquartile 25% (IQ1) | 42.4% | 39.7% |
| Interquartile 75% (IQ3) | 56.6% | 55.3% |
| Interquartile Range (IQR) | 14.2% | 15.6% |
| Standard Deviation (Sample) | 10.0% | 11.4% |
| Standard Deviation (Population) | 9.9% | 11.3% |
Similar Demographics by College, 1 year or more
Demographics Similar to Bangladeshis by College, 1 year or more
In terms of college, 1 year or more, the demographic groups most similar to Bangladeshis are British West Indian (54.5%, a difference of 0.030%), Crow (54.5%, a difference of 0.030%), Bahamian (54.5%, a difference of 0.060%), Comanche (54.4%, a difference of 0.10%), and Immigrants from Grenada (54.4%, a difference of 0.14%).
| Demographics | Rating | Rank | College, 1 year or more |
| Immigrants | St. Vincent and the Grenadines | 0.3 /100 | #262 | Tragic 54.8% |
| U.S. Virgin Islanders | 0.3 /100 | #263 | Tragic 54.8% |
| Immigrants | Micronesia | 0.3 /100 | #264 | Tragic 54.8% |
| Immigrants | Laos | 0.2 /100 | #265 | Tragic 54.7% |
| Potawatomi | 0.2 /100 | #266 | Tragic 54.6% |
| Blackfeet | 0.2 /100 | #267 | Tragic 54.6% |
| British West Indians | 0.2 /100 | #268 | Tragic 54.5% |
| Bangladeshis | 0.2 /100 | #269 | Tragic 54.5% |
| Crow | 0.2 /100 | #270 | Tragic 54.5% |
| Bahamians | 0.2 /100 | #271 | Tragic 54.5% |
| Comanche | 0.2 /100 | #272 | Tragic 54.4% |
| Immigrants | Grenada | 0.2 /100 | #273 | Tragic 54.4% |
| Belizeans | 0.2 /100 | #274 | Tragic 54.4% |
| Americans | 0.2 /100 | #275 | Tragic 54.4% |
| Shoshone | 0.2 /100 | #276 | Tragic 54.3% |
Demographics Similar to Navajo by College, 1 year or more
In terms of college, 1 year or more, the demographic groups most similar to Navajo are Hopi (50.9%, a difference of 0.18%), Immigrants from Guatemala (50.7%, a difference of 0.23%), Immigrants from Cuba (50.7%, a difference of 0.24%), Immigrants from Latin America (50.7%, a difference of 0.27%), and Kiowa (51.0%, a difference of 0.31%).
| Demographics | Rating | Rank | College, 1 year or more |
| Guatemalans | 0.0 /100 | #315 | Tragic 51.2% |
| Cajuns | 0.0 /100 | #316 | Tragic 51.2% |
| Hispanics or Latinos | 0.0 /100 | #317 | Tragic 51.1% |
| Immigrants | Honduras | 0.0 /100 | #318 | Tragic 51.0% |
| Immigrants | El Salvador | 0.0 /100 | #319 | Tragic 51.0% |
| Kiowa | 0.0 /100 | #320 | Tragic 51.0% |
| Hopi | 0.0 /100 | #321 | Tragic 50.9% |
| Navajo | 0.0 /100 | #322 | Tragic 50.8% |
| Immigrants | Guatemala | 0.0 /100 | #323 | Tragic 50.7% |
| Immigrants | Cuba | 0.0 /100 | #324 | Tragic 50.7% |
| Immigrants | Latin America | 0.0 /100 | #325 | Tragic 50.7% |
| Dominicans | 0.0 /100 | #326 | Tragic 50.6% |
| Menominee | 0.0 /100 | #327 | Tragic 50.6% |
| Dutch West Indians | 0.0 /100 | #328 | Tragic 50.5% |
| Cape Verdeans | 0.0 /100 | #329 | Tragic 50.3% |