Ugandan vs Immigrants from Panama GED/Equivalency
COMPARE
Ugandan
Immigrants from Panama
GED/Equivalency
GED/Equivalency Comparison
Ugandans
Immigrants from Panama
86.1%
GED/EQUIVALENCY
66.3/ 100
METRIC RATING
163rd/ 347
METRIC RANK
84.4%
GED/EQUIVALENCY
4.1/ 100
METRIC RATING
233rd/ 347
METRIC RANK
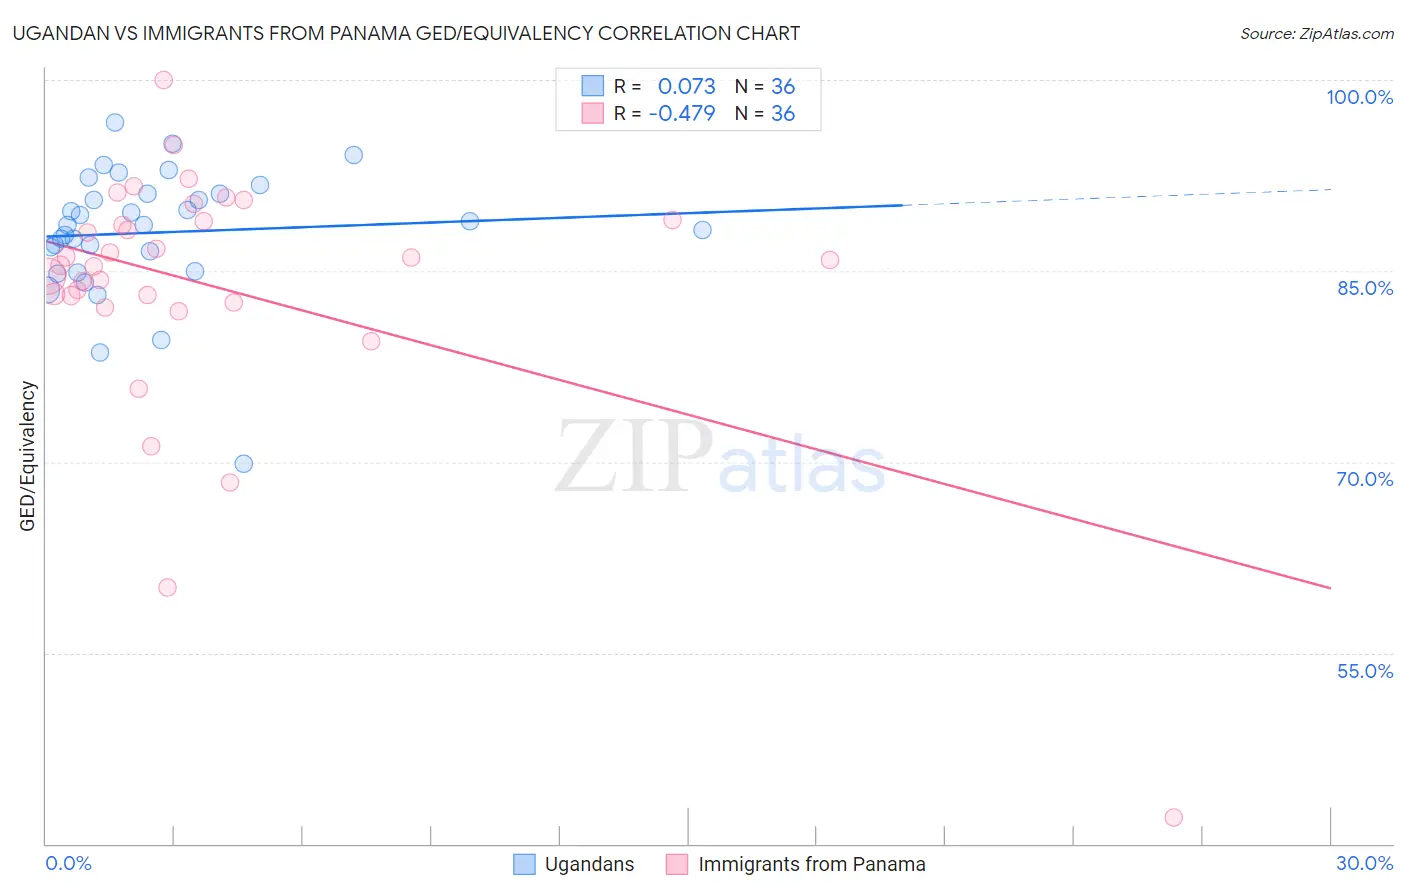
Ugandan vs Immigrants from Panama GED/Equivalency Correlation Chart
The statistical analysis conducted on geographies consisting of 94,018,260 people shows a slight positive correlation between the proportion of Ugandans and percentage of population with at least ged/equivalency education in the United States with a correlation coefficient (R) of 0.073 and weighted average of 86.1%. Similarly, the statistical analysis conducted on geographies consisting of 221,184,524 people shows a moderate negative correlation between the proportion of Immigrants from Panama and percentage of population with at least ged/equivalency education in the United States with a correlation coefficient (R) of -0.479 and weighted average of 84.4%, a difference of 2.0%.
GED/Equivalency Correlation Summary
| Measurement | Ugandan | Immigrants from Panama |
| Minimum | 69.8% | 42.1% |
| Maximum | 96.7% | 100.0% |
| Range | 26.9% | 57.9% |
| Mean | 88.0% | 83.8% |
| Median | 88.6% | 85.7% |
| Interquartile 25% (IQ1) | 85.8% | 82.8% |
| Interquartile 75% (IQ3) | 91.0% | 88.9% |
| Interquartile Range (IQR) | 5.2% | 6.1% |
| Standard Deviation (Sample) | 5.1% | 10.2% |
| Standard Deviation (Population) | 5.0% | 10.1% |
Similar Demographics by GED/Equivalency
Demographics Similar to Ugandans by GED/Equivalency
In terms of ged/equivalency, the demographic groups most similar to Ugandans are Venezuelan (86.0%, a difference of 0.020%), Immigrants from Iraq (86.1%, a difference of 0.040%), Alsatian (86.0%, a difference of 0.040%), Immigrants from Albania (86.0%, a difference of 0.050%), and Ethiopian (86.0%, a difference of 0.060%).
| Demographics | Rating | Rank | GED/Equivalency |
| Immigrants | Nepal | 73.3 /100 | #156 | Good 86.2% |
| Whites/Caucasians | 72.2 /100 | #157 | Good 86.2% |
| German Russians | 72.1 /100 | #158 | Good 86.2% |
| Immigrants | Kenya | 71.8 /100 | #159 | Good 86.2% |
| Immigrants | Morocco | 69.5 /100 | #160 | Good 86.1% |
| Immigrants | Syria | 69.3 /100 | #161 | Good 86.1% |
| Immigrants | Iraq | 68.1 /100 | #162 | Good 86.1% |
| Ugandans | 66.3 /100 | #163 | Good 86.1% |
| Venezuelans | 65.5 /100 | #164 | Good 86.0% |
| Alsatians | 64.3 /100 | #165 | Good 86.0% |
| Immigrants | Albania | 64.2 /100 | #166 | Good 86.0% |
| Ethiopians | 63.7 /100 | #167 | Good 86.0% |
| Sierra Leoneans | 61.8 /100 | #168 | Good 86.0% |
| Immigrants | Ethiopia | 61.2 /100 | #169 | Good 86.0% |
| Afghans | 59.7 /100 | #170 | Average 85.9% |
Demographics Similar to Immigrants from Panama by GED/Equivalency
In terms of ged/equivalency, the demographic groups most similar to Immigrants from Panama are Immigrants from South America (84.4%, a difference of 0.010%), Immigrants from Middle Africa (84.4%, a difference of 0.030%), Immigrants from Colombia (84.4%, a difference of 0.050%), Immigrants from Uruguay (84.4%, a difference of 0.060%), and Immigrants from Nigeria (84.3%, a difference of 0.070%).
| Demographics | Rating | Rank | GED/Equivalency |
| Immigrants | Zaire | 5.5 /100 | #226 | Tragic 84.5% |
| Immigrants | Costa Rica | 5.4 /100 | #227 | Tragic 84.5% |
| Immigrants | Liberia | 4.9 /100 | #228 | Tragic 84.4% |
| Immigrants | Uruguay | 4.6 /100 | #229 | Tragic 84.4% |
| Immigrants | Colombia | 4.5 /100 | #230 | Tragic 84.4% |
| Immigrants | Middle Africa | 4.3 /100 | #231 | Tragic 84.4% |
| Immigrants | South America | 4.2 /100 | #232 | Tragic 84.4% |
| Immigrants | Panama | 4.1 /100 | #233 | Tragic 84.4% |
| Immigrants | Nigeria | 3.6 /100 | #234 | Tragic 84.3% |
| Ghanaians | 3.5 /100 | #235 | Tragic 84.3% |
| Immigrants | Eritrea | 3.5 /100 | #236 | Tragic 84.3% |
| Sub-Saharan Africans | 3.0 /100 | #237 | Tragic 84.2% |
| Immigrants | Peru | 2.7 /100 | #238 | Tragic 84.2% |
| Immigrants | Bahamas | 2.6 /100 | #239 | Tragic 84.2% |
| Immigrants | South Eastern Asia | 2.5 /100 | #240 | Tragic 84.1% |