Ugandan vs Immigrants from Panama Divorced or Separated
COMPARE
Ugandan
Immigrants from Panama
Divorced or Separated
Divorced or Separated Comparison
Ugandans
Immigrants from Panama
11.8%
DIVORCED OR SEPARATED
93.1/ 100
METRIC RATING
124th/ 347
METRIC RANK
12.6%
DIVORCED OR SEPARATED
0.5/ 100
METRIC RATING
263rd/ 347
METRIC RANK
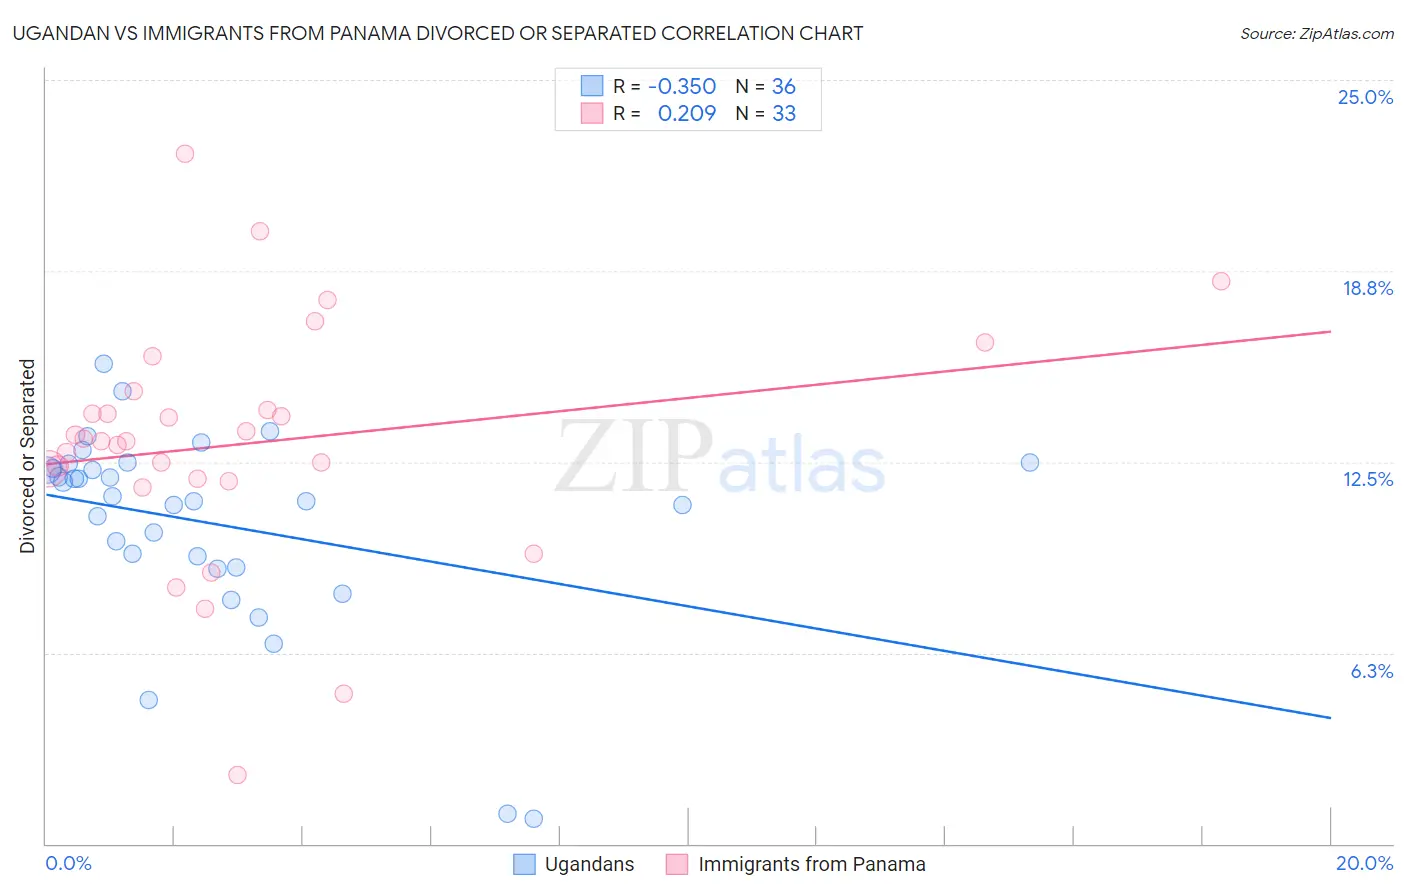
Ugandan vs Immigrants from Panama Divorced or Separated Correlation Chart
The statistical analysis conducted on geographies consisting of 94,013,976 people shows a mild negative correlation between the proportion of Ugandans and percentage of population currently divorced or separated in the United States with a correlation coefficient (R) of -0.350 and weighted average of 11.8%. Similarly, the statistical analysis conducted on geographies consisting of 221,177,980 people shows a weak positive correlation between the proportion of Immigrants from Panama and percentage of population currently divorced or separated in the United States with a correlation coefficient (R) of 0.209 and weighted average of 12.6%, a difference of 7.0%.
Divorced or Separated Correlation Summary
| Measurement | Ugandan | Immigrants from Panama |
| Minimum | 0.80% | 2.3% |
| Maximum | 15.7% | 22.6% |
| Range | 14.9% | 20.3% |
| Mean | 10.5% | 13.1% |
| Median | 11.3% | 13.2% |
| Interquartile 25% (IQ1) | 9.2% | 11.9% |
| Interquartile 75% (IQ3) | 12.4% | 14.5% |
| Interquartile Range (IQR) | 3.1% | 2.6% |
| Standard Deviation (Sample) | 3.3% | 4.0% |
| Standard Deviation (Population) | 3.2% | 3.9% |
Similar Demographics by Divorced or Separated
Demographics Similar to Ugandans by Divorced or Separated
In terms of divorced or separated, the demographic groups most similar to Ugandans are Immigrants (11.8%, a difference of 0.080%), Menominee (11.8%, a difference of 0.090%), Ukrainian (11.8%, a difference of 0.11%), South American Indian (11.8%, a difference of 0.13%), and Romanian (11.8%, a difference of 0.21%).
| Demographics | Rating | Rank | Divorced or Separated |
| Immigrants | Uganda | 95.3 /100 | #117 | Exceptional 11.7% |
| Ecuadorians | 95.3 /100 | #118 | Exceptional 11.7% |
| Syrians | 95.1 /100 | #119 | Exceptional 11.7% |
| Iraqis | 94.6 /100 | #120 | Exceptional 11.8% |
| Romanians | 94.5 /100 | #121 | Exceptional 11.8% |
| Menominee | 93.8 /100 | #122 | Exceptional 11.8% |
| Immigrants | Immigrants | 93.7 /100 | #123 | Exceptional 11.8% |
| Ugandans | 93.1 /100 | #124 | Exceptional 11.8% |
| Ukrainians | 92.3 /100 | #125 | Exceptional 11.8% |
| South American Indians | 92.1 /100 | #126 | Exceptional 11.8% |
| South Africans | 88.9 /100 | #127 | Excellent 11.8% |
| Immigrants | Ecuador | 88.9 /100 | #128 | Excellent 11.8% |
| Immigrants | St. Vincent and the Grenadines | 88.4 /100 | #129 | Excellent 11.8% |
| Immigrants | Austria | 88.2 /100 | #130 | Excellent 11.8% |
| Immigrants | Cambodia | 88.2 /100 | #131 | Excellent 11.8% |
Demographics Similar to Immigrants from Panama by Divorced or Separated
In terms of divorced or separated, the demographic groups most similar to Immigrants from Panama are English (12.6%, a difference of 0.020%), Immigrants from Senegal (12.6%, a difference of 0.030%), Basque (12.6%, a difference of 0.050%), White/Caucasian (12.6%, a difference of 0.050%), and Scottish (12.6%, a difference of 0.090%).
| Demographics | Rating | Rank | Divorced or Separated |
| Immigrants | Colombia | 0.6 /100 | #256 | Tragic 12.6% |
| Immigrants | Somalia | 0.6 /100 | #257 | Tragic 12.6% |
| Indonesians | 0.6 /100 | #258 | Tragic 12.6% |
| Yuman | 0.6 /100 | #259 | Tragic 12.6% |
| Immigrants | Uruguay | 0.6 /100 | #260 | Tragic 12.6% |
| Immigrants | Dominica | 0.5 /100 | #261 | Tragic 12.6% |
| Basques | 0.5 /100 | #262 | Tragic 12.6% |
| Immigrants | Panama | 0.5 /100 | #263 | Tragic 12.6% |
| English | 0.5 /100 | #264 | Tragic 12.6% |
| Immigrants | Senegal | 0.5 /100 | #265 | Tragic 12.6% |
| Whites/Caucasians | 0.5 /100 | #266 | Tragic 12.6% |
| Scottish | 0.4 /100 | #267 | Tragic 12.6% |
| Fijians | 0.4 /100 | #268 | Tragic 12.6% |
| Immigrants | Liberia | 0.4 /100 | #269 | Tragic 12.6% |
| Ute | 0.4 /100 | #270 | Tragic 12.6% |