Immigrants from Caribbean vs Immigrants from Panama GED/Equivalency
COMPARE
Immigrants from Caribbean
Immigrants from Panama
GED/Equivalency
GED/Equivalency Comparison
Immigrants from Caribbean
Immigrants from Panama
80.5%
GED/EQUIVALENCY
0.0/ 100
METRIC RATING
317th/ 347
METRIC RANK
84.4%
GED/EQUIVALENCY
4.1/ 100
METRIC RATING
233rd/ 347
METRIC RANK
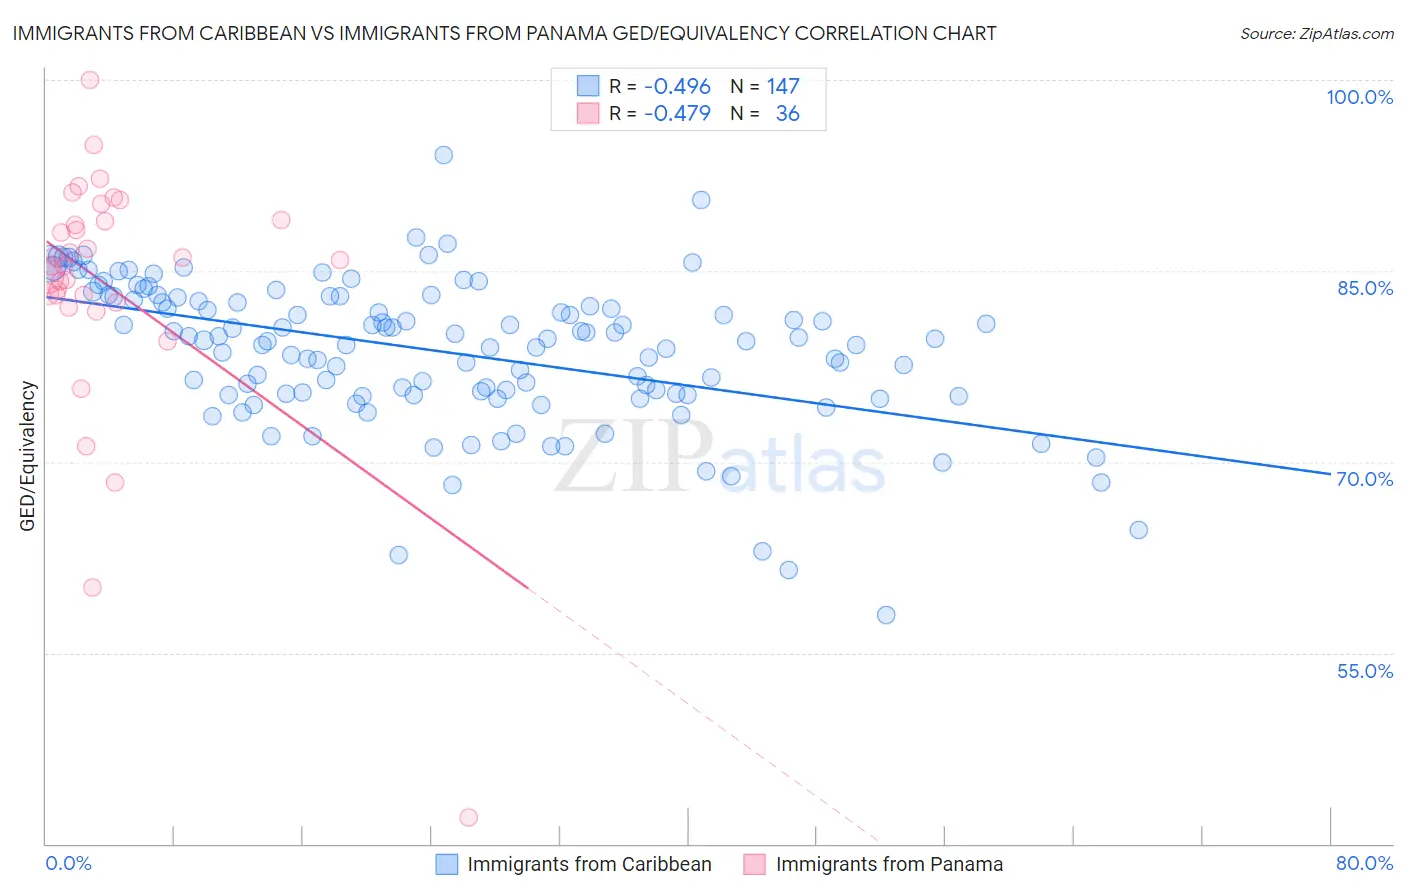
Immigrants from Caribbean vs Immigrants from Panama GED/Equivalency Correlation Chart
The statistical analysis conducted on geographies consisting of 450,064,654 people shows a moderate negative correlation between the proportion of Immigrants from Caribbean and percentage of population with at least ged/equivalency education in the United States with a correlation coefficient (R) of -0.496 and weighted average of 80.5%. Similarly, the statistical analysis conducted on geographies consisting of 221,184,524 people shows a moderate negative correlation between the proportion of Immigrants from Panama and percentage of population with at least ged/equivalency education in the United States with a correlation coefficient (R) of -0.479 and weighted average of 84.4%, a difference of 4.8%.
GED/Equivalency Correlation Summary
| Measurement | Immigrants from Caribbean | Immigrants from Panama |
| Minimum | 58.0% | 42.1% |
| Maximum | 94.1% | 100.0% |
| Range | 36.2% | 57.9% |
| Mean | 78.7% | 83.8% |
| Median | 79.5% | 85.7% |
| Interquartile 25% (IQ1) | 75.3% | 82.8% |
| Interquartile 75% (IQ3) | 82.9% | 88.9% |
| Interquartile Range (IQR) | 7.6% | 6.1% |
| Standard Deviation (Sample) | 5.7% | 10.2% |
| Standard Deviation (Population) | 5.7% | 10.1% |
Similar Demographics by GED/Equivalency
Demographics Similar to Immigrants from Caribbean by GED/Equivalency
In terms of ged/equivalency, the demographic groups most similar to Immigrants from Caribbean are Yaqui (80.5%, a difference of 0.020%), Immigrants from Belize (80.5%, a difference of 0.020%), Central American Indian (80.6%, a difference of 0.10%), Apache (80.7%, a difference of 0.24%), and Immigrants from Cuba (80.2%, a difference of 0.43%).
| Demographics | Rating | Rank | GED/Equivalency |
| Immigrants | Guyana | 0.0 /100 | #310 | Tragic 81.0% |
| Natives/Alaskans | 0.0 /100 | #311 | Tragic 80.9% |
| Nicaraguans | 0.0 /100 | #312 | Tragic 80.9% |
| Cape Verdeans | 0.0 /100 | #313 | Tragic 80.9% |
| Belizeans | 0.0 /100 | #314 | Tragic 80.9% |
| Apache | 0.0 /100 | #315 | Tragic 80.7% |
| Central American Indians | 0.0 /100 | #316 | Tragic 80.6% |
| Immigrants | Caribbean | 0.0 /100 | #317 | Tragic 80.5% |
| Yaqui | 0.0 /100 | #318 | Tragic 80.5% |
| Immigrants | Belize | 0.0 /100 | #319 | Tragic 80.5% |
| Immigrants | Cuba | 0.0 /100 | #320 | Tragic 80.2% |
| Yup'ik | 0.0 /100 | #321 | Tragic 80.0% |
| Lumbee | 0.0 /100 | #322 | Tragic 80.0% |
| Immigrants | Nicaragua | 0.0 /100 | #323 | Tragic 79.9% |
| Mexican American Indians | 0.0 /100 | #324 | Tragic 79.4% |
Demographics Similar to Immigrants from Panama by GED/Equivalency
In terms of ged/equivalency, the demographic groups most similar to Immigrants from Panama are Immigrants from South America (84.4%, a difference of 0.010%), Immigrants from Middle Africa (84.4%, a difference of 0.030%), Immigrants from Colombia (84.4%, a difference of 0.050%), Immigrants from Uruguay (84.4%, a difference of 0.060%), and Immigrants from Nigeria (84.3%, a difference of 0.070%).
| Demographics | Rating | Rank | GED/Equivalency |
| Immigrants | Zaire | 5.5 /100 | #226 | Tragic 84.5% |
| Immigrants | Costa Rica | 5.4 /100 | #227 | Tragic 84.5% |
| Immigrants | Liberia | 4.9 /100 | #228 | Tragic 84.4% |
| Immigrants | Uruguay | 4.6 /100 | #229 | Tragic 84.4% |
| Immigrants | Colombia | 4.5 /100 | #230 | Tragic 84.4% |
| Immigrants | Middle Africa | 4.3 /100 | #231 | Tragic 84.4% |
| Immigrants | South America | 4.2 /100 | #232 | Tragic 84.4% |
| Immigrants | Panama | 4.1 /100 | #233 | Tragic 84.4% |
| Immigrants | Nigeria | 3.6 /100 | #234 | Tragic 84.3% |
| Ghanaians | 3.5 /100 | #235 | Tragic 84.3% |
| Immigrants | Eritrea | 3.5 /100 | #236 | Tragic 84.3% |
| Sub-Saharan Africans | 3.0 /100 | #237 | Tragic 84.2% |
| Immigrants | Peru | 2.7 /100 | #238 | Tragic 84.2% |
| Immigrants | Bahamas | 2.6 /100 | #239 | Tragic 84.2% |
| Immigrants | South Eastern Asia | 2.5 /100 | #240 | Tragic 84.1% |