Ecuadorian vs Immigrants from Panama GED/Equivalency
COMPARE
Ecuadorian
Immigrants from Panama
GED/Equivalency
GED/Equivalency Comparison
Ecuadorians
Immigrants from Panama
81.7%
GED/EQUIVALENCY
0.0/ 100
METRIC RATING
299th/ 347
METRIC RANK
84.4%
GED/EQUIVALENCY
4.1/ 100
METRIC RATING
233rd/ 347
METRIC RANK
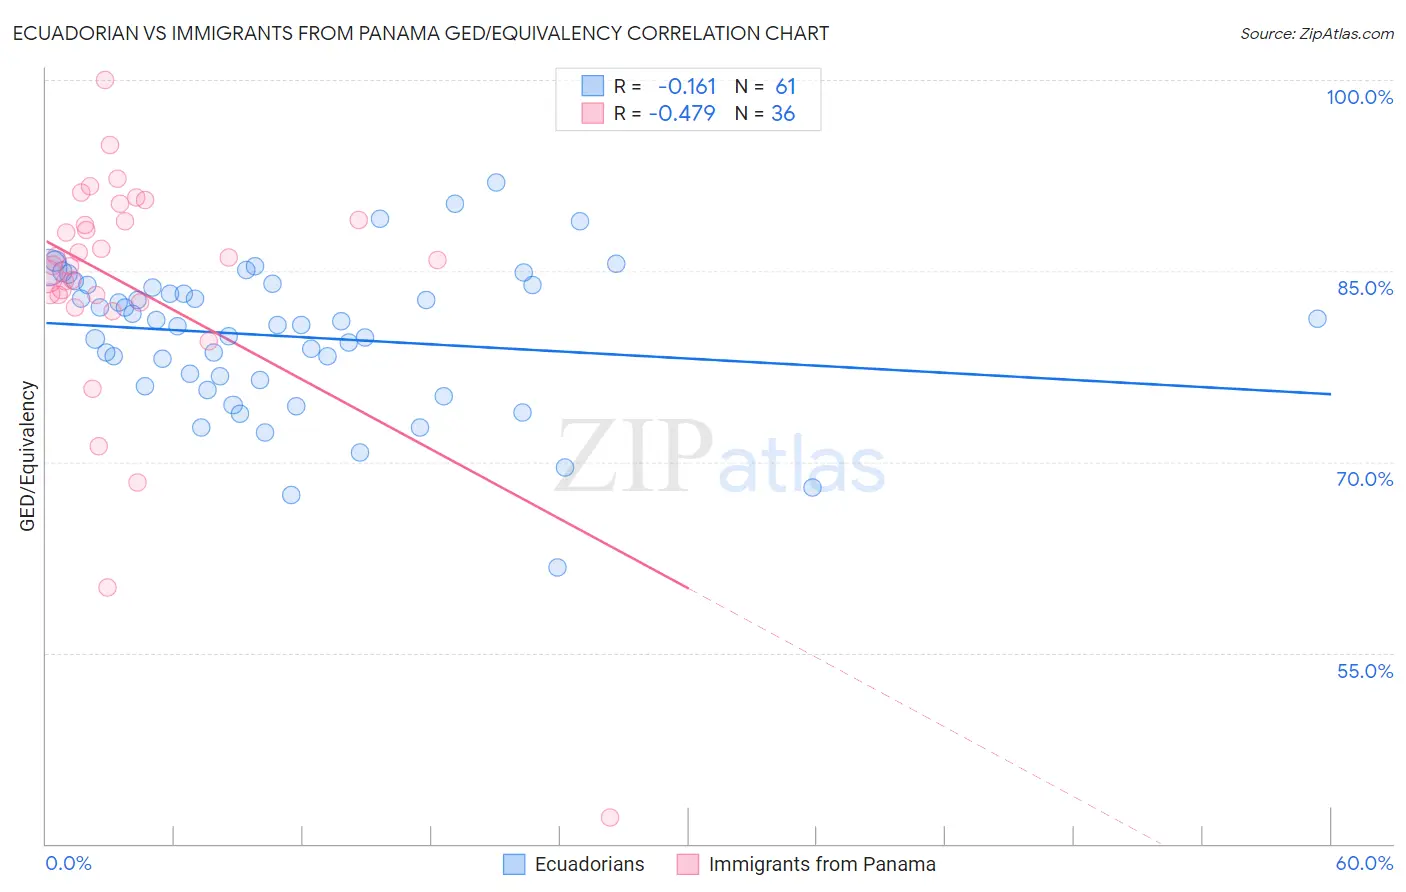
Ecuadorian vs Immigrants from Panama GED/Equivalency Correlation Chart
The statistical analysis conducted on geographies consisting of 317,864,750 people shows a poor negative correlation between the proportion of Ecuadorians and percentage of population with at least ged/equivalency education in the United States with a correlation coefficient (R) of -0.161 and weighted average of 81.7%. Similarly, the statistical analysis conducted on geographies consisting of 221,184,524 people shows a moderate negative correlation between the proportion of Immigrants from Panama and percentage of population with at least ged/equivalency education in the United States with a correlation coefficient (R) of -0.479 and weighted average of 84.4%, a difference of 3.3%.
GED/Equivalency Correlation Summary
| Measurement | Ecuadorian | Immigrants from Panama |
| Minimum | 61.7% | 42.1% |
| Maximum | 91.9% | 100.0% |
| Range | 30.2% | 57.9% |
| Mean | 79.8% | 83.8% |
| Median | 80.8% | 85.7% |
| Interquartile 25% (IQ1) | 76.2% | 82.8% |
| Interquartile 75% (IQ3) | 83.9% | 88.9% |
| Interquartile Range (IQR) | 7.7% | 6.1% |
| Standard Deviation (Sample) | 5.8% | 10.2% |
| Standard Deviation (Population) | 5.8% | 10.1% |
Similar Demographics by GED/Equivalency
Demographics Similar to Ecuadorians by GED/Equivalency
In terms of ged/equivalency, the demographic groups most similar to Ecuadorians are Fijian (81.6%, a difference of 0.070%), Dutch West Indian (81.6%, a difference of 0.13%), Ute (81.8%, a difference of 0.14%), Immigrants from Haiti (81.6%, a difference of 0.16%), and Immigrants from Portugal (81.6%, a difference of 0.17%).
| Demographics | Rating | Rank | GED/Equivalency |
| Paiute | 0.0 /100 | #292 | Tragic 82.0% |
| British West Indians | 0.0 /100 | #293 | Tragic 82.0% |
| Immigrants | St. Vincent and the Grenadines | 0.0 /100 | #294 | Tragic 82.0% |
| Nepalese | 0.0 /100 | #295 | Tragic 81.9% |
| Vietnamese | 0.0 /100 | #296 | Tragic 81.9% |
| Immigrants | Bangladesh | 0.0 /100 | #297 | Tragic 81.9% |
| Ute | 0.0 /100 | #298 | Tragic 81.8% |
| Ecuadorians | 0.0 /100 | #299 | Tragic 81.7% |
| Fijians | 0.0 /100 | #300 | Tragic 81.6% |
| Dutch West Indians | 0.0 /100 | #301 | Tragic 81.6% |
| Immigrants | Haiti | 0.0 /100 | #302 | Tragic 81.6% |
| Immigrants | Portugal | 0.0 /100 | #303 | Tragic 81.6% |
| Navajo | 0.0 /100 | #304 | Tragic 81.5% |
| Immigrants | Grenada | 0.0 /100 | #305 | Tragic 81.3% |
| Guyanese | 0.0 /100 | #306 | Tragic 81.3% |
Demographics Similar to Immigrants from Panama by GED/Equivalency
In terms of ged/equivalency, the demographic groups most similar to Immigrants from Panama are Immigrants from South America (84.4%, a difference of 0.010%), Immigrants from Middle Africa (84.4%, a difference of 0.030%), Immigrants from Colombia (84.4%, a difference of 0.050%), Immigrants from Uruguay (84.4%, a difference of 0.060%), and Immigrants from Nigeria (84.3%, a difference of 0.070%).
| Demographics | Rating | Rank | GED/Equivalency |
| Immigrants | Zaire | 5.5 /100 | #226 | Tragic 84.5% |
| Immigrants | Costa Rica | 5.4 /100 | #227 | Tragic 84.5% |
| Immigrants | Liberia | 4.9 /100 | #228 | Tragic 84.4% |
| Immigrants | Uruguay | 4.6 /100 | #229 | Tragic 84.4% |
| Immigrants | Colombia | 4.5 /100 | #230 | Tragic 84.4% |
| Immigrants | Middle Africa | 4.3 /100 | #231 | Tragic 84.4% |
| Immigrants | South America | 4.2 /100 | #232 | Tragic 84.4% |
| Immigrants | Panama | 4.1 /100 | #233 | Tragic 84.4% |
| Immigrants | Nigeria | 3.6 /100 | #234 | Tragic 84.3% |
| Ghanaians | 3.5 /100 | #235 | Tragic 84.3% |
| Immigrants | Eritrea | 3.5 /100 | #236 | Tragic 84.3% |
| Sub-Saharan Africans | 3.0 /100 | #237 | Tragic 84.2% |
| Immigrants | Peru | 2.7 /100 | #238 | Tragic 84.2% |
| Immigrants | Bahamas | 2.6 /100 | #239 | Tragic 84.2% |
| Immigrants | South Eastern Asia | 2.5 /100 | #240 | Tragic 84.1% |