Ugandan vs South American GED/Equivalency
COMPARE
Ugandan
South American
GED/Equivalency
GED/Equivalency Comparison
Ugandans
South Americans
86.1%
GED/EQUIVALENCY
66.3/ 100
METRIC RATING
163rd/ 347
METRIC RANK
84.8%
GED/EQUIVALENCY
10.9/ 100
METRIC RATING
211th/ 347
METRIC RANK
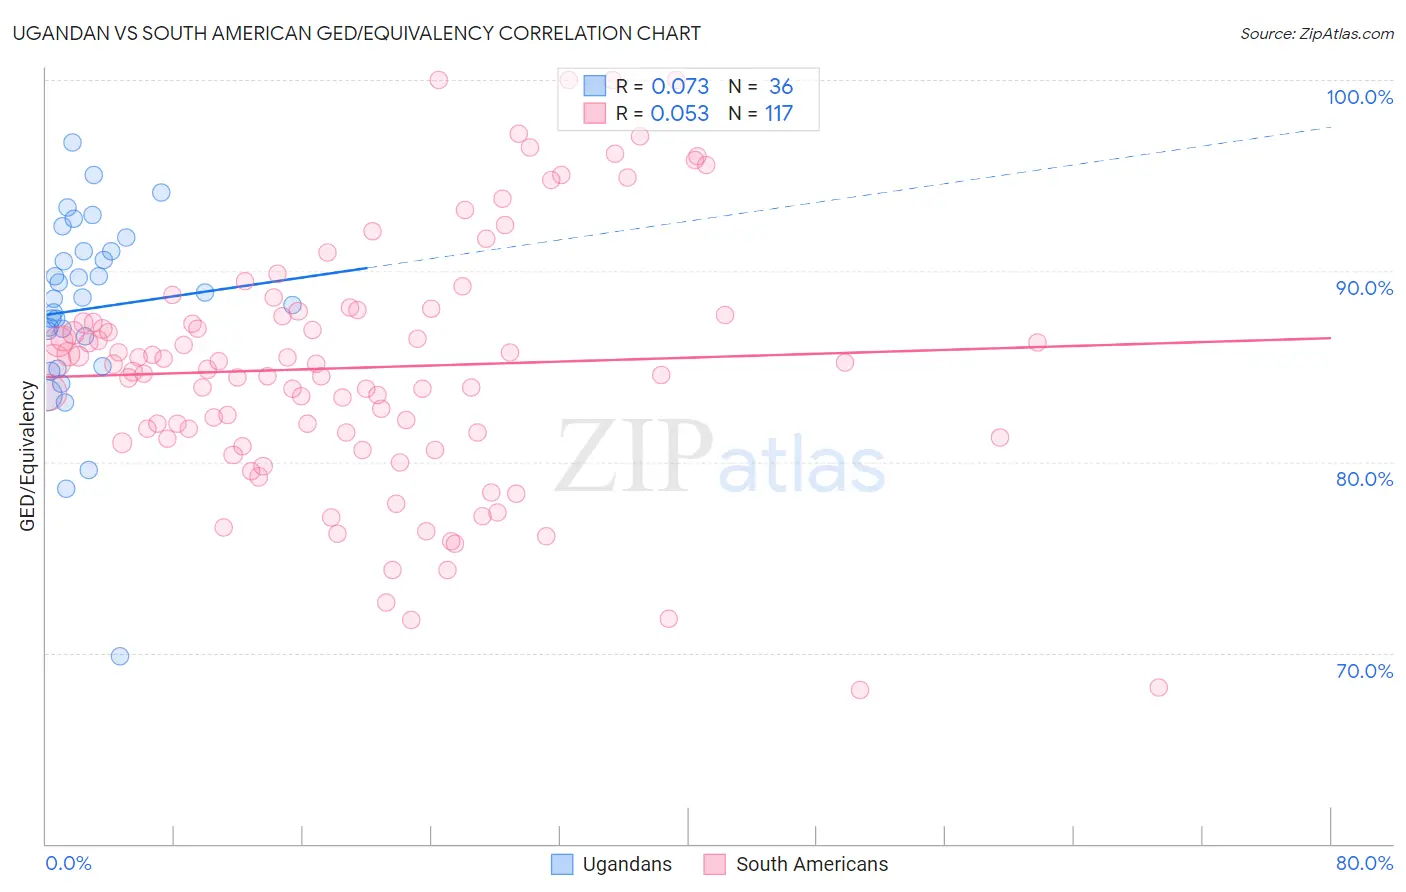
Ugandan vs South American GED/Equivalency Correlation Chart
The statistical analysis conducted on geographies consisting of 94,018,260 people shows a slight positive correlation between the proportion of Ugandans and percentage of population with at least ged/equivalency education in the United States with a correlation coefficient (R) of 0.073 and weighted average of 86.1%. Similarly, the statistical analysis conducted on geographies consisting of 494,065,729 people shows a slight positive correlation between the proportion of South Americans and percentage of population with at least ged/equivalency education in the United States with a correlation coefficient (R) of 0.053 and weighted average of 84.8%, a difference of 1.4%.
GED/Equivalency Correlation Summary
| Measurement | Ugandan | South American |
| Minimum | 69.8% | 68.0% |
| Maximum | 96.7% | 100.0% |
| Range | 26.9% | 32.0% |
| Mean | 88.0% | 84.9% |
| Median | 88.6% | 85.1% |
| Interquartile 25% (IQ1) | 85.8% | 81.2% |
| Interquartile 75% (IQ3) | 91.0% | 87.8% |
| Interquartile Range (IQR) | 5.2% | 6.5% |
| Standard Deviation (Sample) | 5.1% | 6.6% |
| Standard Deviation (Population) | 5.0% | 6.6% |
Similar Demographics by GED/Equivalency
Demographics Similar to Ugandans by GED/Equivalency
In terms of ged/equivalency, the demographic groups most similar to Ugandans are Venezuelan (86.0%, a difference of 0.020%), Immigrants from Iraq (86.1%, a difference of 0.040%), Alsatian (86.0%, a difference of 0.040%), Immigrants from Albania (86.0%, a difference of 0.050%), and Ethiopian (86.0%, a difference of 0.060%).
| Demographics | Rating | Rank | GED/Equivalency |
| Immigrants | Nepal | 73.3 /100 | #156 | Good 86.2% |
| Whites/Caucasians | 72.2 /100 | #157 | Good 86.2% |
| German Russians | 72.1 /100 | #158 | Good 86.2% |
| Immigrants | Kenya | 71.8 /100 | #159 | Good 86.2% |
| Immigrants | Morocco | 69.5 /100 | #160 | Good 86.1% |
| Immigrants | Syria | 69.3 /100 | #161 | Good 86.1% |
| Immigrants | Iraq | 68.1 /100 | #162 | Good 86.1% |
| Ugandans | 66.3 /100 | #163 | Good 86.1% |
| Venezuelans | 65.5 /100 | #164 | Good 86.0% |
| Alsatians | 64.3 /100 | #165 | Good 86.0% |
| Immigrants | Albania | 64.2 /100 | #166 | Good 86.0% |
| Ethiopians | 63.7 /100 | #167 | Good 86.0% |
| Sierra Leoneans | 61.8 /100 | #168 | Good 86.0% |
| Immigrants | Ethiopia | 61.2 /100 | #169 | Good 86.0% |
| Afghans | 59.7 /100 | #170 | Average 85.9% |
Demographics Similar to South Americans by GED/Equivalency
In terms of ged/equivalency, the demographic groups most similar to South Americans are Immigrants from Somalia (84.8%, a difference of 0.020%), Immigrants from Philippines (84.8%, a difference of 0.050%), Immigrants from Cameroon (84.9%, a difference of 0.060%), Colombian (84.9%, a difference of 0.070%), and Marshallese (84.9%, a difference of 0.080%).
| Demographics | Rating | Rank | GED/Equivalency |
| Hawaiians | 15.2 /100 | #204 | Poor 85.0% |
| Liberians | 14.6 /100 | #205 | Poor 85.0% |
| Samoans | 13.7 /100 | #206 | Poor 84.9% |
| Hmong | 13.1 /100 | #207 | Poor 84.9% |
| Marshallese | 12.5 /100 | #208 | Poor 84.9% |
| Colombians | 12.3 /100 | #209 | Poor 84.9% |
| Immigrants | Cameroon | 12.1 /100 | #210 | Poor 84.9% |
| South Americans | 10.9 /100 | #211 | Poor 84.8% |
| Immigrants | Somalia | 10.6 /100 | #212 | Poor 84.8% |
| Immigrants | Philippines | 10.0 /100 | #213 | Poor 84.8% |
| Osage | 9.5 /100 | #214 | Tragic 84.8% |
| Peruvians | 9.2 /100 | #215 | Tragic 84.7% |
| Immigrants | Micronesia | 8.7 /100 | #216 | Tragic 84.7% |
| Nigerians | 8.6 /100 | #217 | Tragic 84.7% |
| Alaska Natives | 8.6 /100 | #218 | Tragic 84.7% |