Bolivian vs Immigrants from Panama GED/Equivalency

COMPARE

Bolivian
Race
Ancestry
AfghanAfricanAlaska NativeAlaskan AthabascanAlbanianAleutAlsatianAmericanApacheArabArapahoArgentineanArmenianAssyrian/Chaldean/SyriacAustralianAustrianBahamianBangladeshiBarbadianBasqueBelgianBelizeanBermudanBhutaneseBlackfeetBolivianBrazilianBritishBritish West IndianBulgarianBurmeseCajunCambodianCanadianCape VerdeanCarpatho RusynCelticCentral AmericanCentral American IndianCherokeeCheyenneChickasawChileanChineseChippewaChoctawColombianColvilleComancheCosta RicanCreeCreekCroatianCrowCubanCypriotCzechCzechoslovakianDanishDelawareDominicanDutchDutch West IndianEastern EuropeanEcuadorianEgyptianEnglishEstonianEthiopianEuropeanFijianFilipinoFinnishFrenchFrench American IndianFrench CanadianGermanGerman RussianGhanaianGreekGuamanian/ChamorroGuatemalanGuyaneseHaitianHmongHonduranHopiHoumaHungarianIcelanderIndian (Asian)IndonesianInupiatIranianIraqiIrishIroquoisIsraeliItalianJamaicanJapaneseJordanianKenyanKiowaKoreanLaotianLatvianLebaneseLiberianLithuanianLumbeeLuxembourgerMacedonianMalaysianMalteseMarshalleseMenomineeMexicanMexican American IndianMongolianMoroccanNative HawaiianNavajoNepaleseNew ZealanderNicaraguanNigerianNorthern EuropeanNorwegianOkinawanOsageOttawaPaiutePakistaniPalestinianPanamanianParaguayanPennsylvania GermanPeruvianPimaPolishPortuguesePotawatomiPuebloPuerto RicanPuget Sound SalishRomanianRussianSalvadoranSamoanScandinavianScotch-IrishScottishSeminoleSenegaleseSerbianShoshoneSierra LeoneanSiouxSlavicSlovakSloveneSomaliSouth AfricanSouth AmericanSouth American IndianSoviet UnionSpaniardSpanishSpanish AmericanSpanish American IndianSri LankanSubsaharan AfricanSudaneseSwedishSwissSyrianTaiwaneseThaiTlingit-HaidaTohono O'OdhamTonganTrinidadian and TobagonianTsimshianTurkishU.S. Virgin IslanderUgandanUkrainianUruguayanUteVenezuelanVietnameseWelshWest IndianYakamaYaquiYugoslavianYumanYup'ikZimbabwean
Immigration
NonimmigrantsImmigrantsAfghanistanAfricaAlbaniaArgentinaArmeniaAsiaAustraliaAustriaBahamasBangladeshBarbadosBelarusBelgiumBelizeBoliviaBosnia and HerzegovinaBrazilBulgariaBurma/MyanmarCabo VerdeCambodiaCameroonCanadaCaribbeanCentral AmericaChileChinaColombiaCongoCosta RicaCroatiaCubaCzechoslovakiaDenmarkDominicaDominican RepublicEastern AfricaEastern AsiaEastern EuropeEcuadorEgyptEl SalvadorEnglandEritreaEthiopiaEuropeFijiFranceGermanyGhanaGreeceGrenadaGuatemalaGuyanaHaitiHondurasHong KongHungaryIndiaIndonesiaIranIraqIrelandIsraelItalyJamaicaJapanJordanKazakhstanKenyaKoreaKuwaitLaosLatin AmericaLatviaLebanonLiberiaLithuaniaMalaysiaMexicoMicronesiaMiddle AfricaMoldovaMoroccoNepalNetherlandsNicaraguaNigeriaNorth AmericaNorth MacedoniaNorthern AfricaNorthern EuropeNorwayOceaniaPakistanPeruPhilippinesPolandPortugalRomaniaRussiaSaudi ArabiaScotlandSenegalSerbiaSierra LeoneSingaporeSomaliaSouth AfricaSouth AmericaSouth Central AsiaSouth Eastern AsiaSouthern EuropeSpainSri LankaSt. Vincent and the GrenadinesSudanSwedenSwitzerlandSyriaTaiwanThailandTrinidad and TobagoTurkeyUgandaUkraineUruguayUzbekistanVenezuelaVietnamWest IndiesWestern AfricaWestern AsiaWestern EuropeYemenZaireZimbabweAzores
Immigrants from Panama
Race
Ancestry
AfghanAfricanAlaska NativeAlaskan AthabascanAlbanianAleutAlsatianAmericanApacheArabArapahoArgentineanArmenianAssyrian/Chaldean/SyriacAustralianAustrianBahamianBangladeshiBarbadianBasqueBelgianBelizeanBermudanBhutaneseBlackfeetBrazilianBritishBritish West IndianBulgarianBurmeseCajunCambodianCanadianCape VerdeanCarpatho RusynCelticCentral AmericanCentral American IndianCherokeeCheyenneChickasawChileanChineseChippewaChoctawColombianColvilleComancheCosta RicanCreeCreekCroatianCrowCubanCypriotCzechCzechoslovakianDanishDelawareDominicanDutchDutch West IndianEastern EuropeanEcuadorianEgyptianEnglishEstonianEthiopianEuropeanFijianFilipinoFinnishFrenchFrench American IndianFrench CanadianGermanGerman RussianGhanaianGreekGuamanian/ChamorroGuatemalanGuyaneseHaitianHmongHonduranHopiHoumaHungarianIcelanderIndian (Asian)IndonesianInupiatIranianIraqiIrishIroquoisIsraeliItalianJamaicanJapaneseJordanianKenyanKiowaKoreanLaotianLatvianLebaneseLiberianLithuanianLumbeeLuxembourgerMacedonianMalaysianMalteseMarshalleseMenomineeMexicanMexican American IndianMongolianMoroccanNative HawaiianNavajoNepaleseNew ZealanderNicaraguanNigerianNorthern EuropeanNorwegianOkinawanOsageOttawaPaiutePakistaniPalestinianPanamanianParaguayanPennsylvania GermanPeruvianPimaPolishPortuguesePotawatomiPuebloPuerto RicanPuget Sound SalishRomanianRussianSalvadoranSamoanScandinavianScotch-IrishScottishSeminoleSenegaleseSerbianShoshoneSierra LeoneanSiouxSlavicSlovakSloveneSomaliSouth AfricanSouth AmericanSouth American IndianSoviet UnionSpaniardSpanishSpanish AmericanSpanish American IndianSri LankanSubsaharan AfricanSudaneseSwedishSwissSyrianTaiwaneseThaiTlingit-HaidaTohono O'OdhamTonganTrinidadian and TobagonianTsimshianTurkishU.S. Virgin IslanderUgandanUkrainianUruguayanUteVenezuelanVietnameseWelshWest IndianYakamaYaquiYugoslavianYumanYup'ikZimbabwean
Immigration
NonimmigrantsImmigrantsAfghanistanAfricaAlbaniaArgentinaArmeniaAsiaAustraliaAustriaBahamasBangladeshBarbadosBelarusBelgiumBelizeBoliviaBosnia and HerzegovinaBrazilBulgariaBurma/MyanmarCabo VerdeCambodiaCameroonCanadaCaribbeanCentral AmericaChileChinaColombiaCongoCosta RicaCroatiaCubaCzechoslovakiaDenmarkDominicaDominican RepublicEastern AfricaEastern AsiaEastern EuropeEcuadorEgyptEl SalvadorEnglandEritreaEthiopiaEuropeFijiFranceGermanyGhanaGreeceGrenadaGuatemalaGuyanaHaitiHondurasHong KongHungaryIndiaIndonesiaIranIraqIrelandIsraelItalyJamaicaJapanJordanKazakhstanKenyaKoreaKuwaitLaosLatin AmericaLatviaLebanonLiberiaLithuaniaMalaysiaMexicoMicronesiaMiddle AfricaMoldovaMoroccoNepalNetherlandsNicaraguaNigeriaNorth AmericaNorth MacedoniaNorthern AfricaNorthern EuropeNorwayOceaniaPakistanPanamaPeruPhilippinesPolandPortugalRomaniaRussiaSaudi ArabiaScotlandSenegalSerbiaSierra LeoneSingaporeSomaliaSouth AfricaSouth AmericaSouth Central AsiaSouth Eastern AsiaSouthern EuropeSpainSri LankaSt. Vincent and the GrenadinesSudanSwedenSwitzerlandSyriaTaiwanThailandTrinidad and TobagoTurkeyUgandaUkraineUruguayUzbekistanVenezuelaVietnamWest IndiesWestern AfricaWestern AsiaWestern EuropeYemenZaireZimbabweAzores
GED/Equivalency
Income
Poverty
Unemployment
Labor Participation
Family Structure
Vehicle Availability
Education Level
Disability

GED/Equivalency Comparison

Bolivians

Immigrants from Panama

Excellent
Tragic
86.4%
GED/EQUIVALENCY
82.1/ 100
METRIC RATING
144th/ 347
METRIC RANK
84.4%
GED/EQUIVALENCY
4.1/ 100
METRIC RATING
233rd/ 347
METRIC RANK

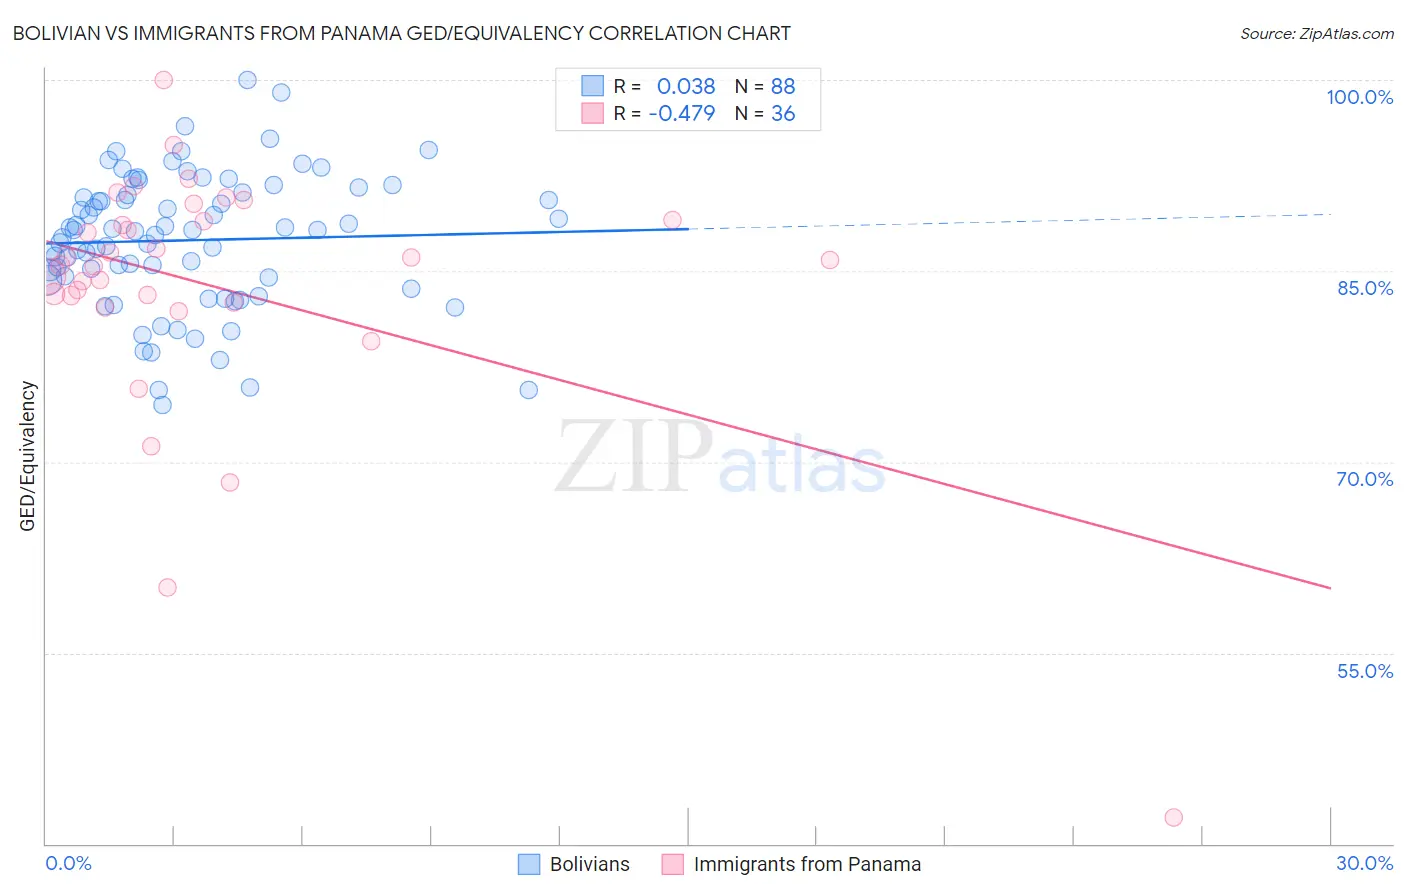
Bolivian vs Immigrants from Panama GED/Equivalency Correlation Chart

The statistical analysis conducted on geographies consisting of 184,667,452 people shows no correlation between the proportion of Bolivians and percentage of population with at least ged/equivalency education in the United States with a correlation coefficient (R) of 0.038 and weighted average of 86.4%. Similarly, the statistical analysis conducted on geographies consisting of 221,184,524 people shows a moderate negative correlation between the proportion of Immigrants from Panama and percentage of population with at least ged/equivalency education in the United States with a correlation coefficient (R) of -0.479 and weighted average of 84.4%, a difference of 2.4%.
Bolivian vs Immigrants from Panama GED/Equivalency

GED/Equivalency Correlation Summary

MeasurementBolivianImmigrants from Panama
Minimum74.4%42.1%
Maximum100.0%100.0%
Range25.6%57.9%
Mean87.4%83.8%
Median88.1%85.7%
Interquartile 25% (IQ1)84.4%82.8%
Interquartile 75% (IQ3)91.0%88.9%
Interquartile Range (IQR)6.7%6.1%
Standard Deviation (Sample)5.3%10.2%
Standard Deviation (Population)5.3%10.1%

Similar Demographics by GED/Equivalency

Demographics Similar to Bolivians by GED/Equivalency

In terms of ged/equivalency, the demographic groups most similar to Bolivians are Immigrants from Indonesia (86.4%, a difference of 0.010%), Immigrants from Pakistan (86.4%, a difference of 0.010%), Laotian (86.5%, a difference of 0.040%), Pakistani (86.4%, a difference of 0.060%), and Paraguayan (86.5%, a difference of 0.070%).
DemographicsRating | RankGED/Equivalency
Arabs
86.7
/100
|
#137
Excellent
86.6%
Immigrants | Argentina
86.5
/100
|
#138
Excellent
86.6%
Immigrants | Malaysia
85.0
/100
|
#139
Excellent
86.5%
Paraguayans
84.1
/100
|
#140
Excellent
86.5%
Laotians
83.2
/100
|
#141
Excellent
86.5%
Immigrants | Indonesia
82.4
/100
|
#142
Excellent
86.4%
Immigrants | Pakistan
82.4
/100
|
#143
Excellent
86.4%
Bolivians
82.1
/100
|
#144
Excellent
86.4%
Pakistanis
80.4
/100
|
#145
Excellent
86.4%
Basques
79.5
/100
|
#146
Good
86.4%
Immigrants | Northern Africa
79.3
/100
|
#147
Good
86.3%
Immigrants | Poland
79.3
/100
|
#148
Good
86.3%
Menominee
79.3
/100
|
#149
Good
86.3%
Immigrants | Western Asia
78.8
/100
|
#150
Good
86.3%
Immigrants | Bosnia and Herzegovina
77.9
/100
|
#151
Good
86.3%

Demographics Similar to Immigrants from Panama by GED/Equivalency

In terms of ged/equivalency, the demographic groups most similar to Immigrants from Panama are Immigrants from South America (84.4%, a difference of 0.010%), Immigrants from Middle Africa (84.4%, a difference of 0.030%), Immigrants from Colombia (84.4%, a difference of 0.050%), Immigrants from Uruguay (84.4%, a difference of 0.060%), and Immigrants from Nigeria (84.3%, a difference of 0.070%).
DemographicsRating | RankGED/Equivalency
Immigrants | Zaire
5.5
/100
|
#226
Tragic
84.5%
Immigrants | Costa Rica
5.4
/100
|
#227
Tragic
84.5%
Immigrants | Liberia
4.9
/100
|
#228
Tragic
84.4%
Immigrants | Uruguay
4.6
/100
|
#229
Tragic
84.4%
Immigrants | Colombia
4.5
/100
|
#230
Tragic
84.4%
Immigrants | Middle Africa
4.3
/100
|
#231
Tragic
84.4%
Immigrants | South America
4.2
/100
|
#232
Tragic
84.4%
Immigrants | Panama
4.1
/100
|
#233
Tragic
84.4%
Immigrants | Nigeria
3.6
/100
|
#234
Tragic
84.3%
Ghanaians
3.5
/100
|
#235
Tragic
84.3%
Immigrants | Eritrea
3.5
/100
|
#236
Tragic
84.3%
Sub-Saharan Africans
3.0
/100
|
#237
Tragic
84.2%
Immigrants | Peru
2.7
/100
|
#238
Tragic
84.2%
Immigrants | Bahamas
2.6
/100
|
#239
Tragic
84.2%
Immigrants | South Eastern Asia
2.5
/100
|
#240
Tragic
84.1%