Ugandan vs Immigrants from Panama Unemployment Among Women with Children Under 6 years
COMPARE
Ugandan
Immigrants from Panama
Unemployment Among Women with Children Under 6 years
Unemployment Among Women with Children Under 6 years Comparison
Ugandans
Immigrants from Panama
7.6%
UNEMPLOYMENT AMONG WOMEN WITH CHILDREN UNDER 6 YEARS
65.8/ 100
METRIC RATING
164th/ 347
METRIC RANK
7.7%
UNEMPLOYMENT AMONG WOMEN WITH CHILDREN UNDER 6 YEARS
35.7/ 100
METRIC RATING
189th/ 347
METRIC RANK
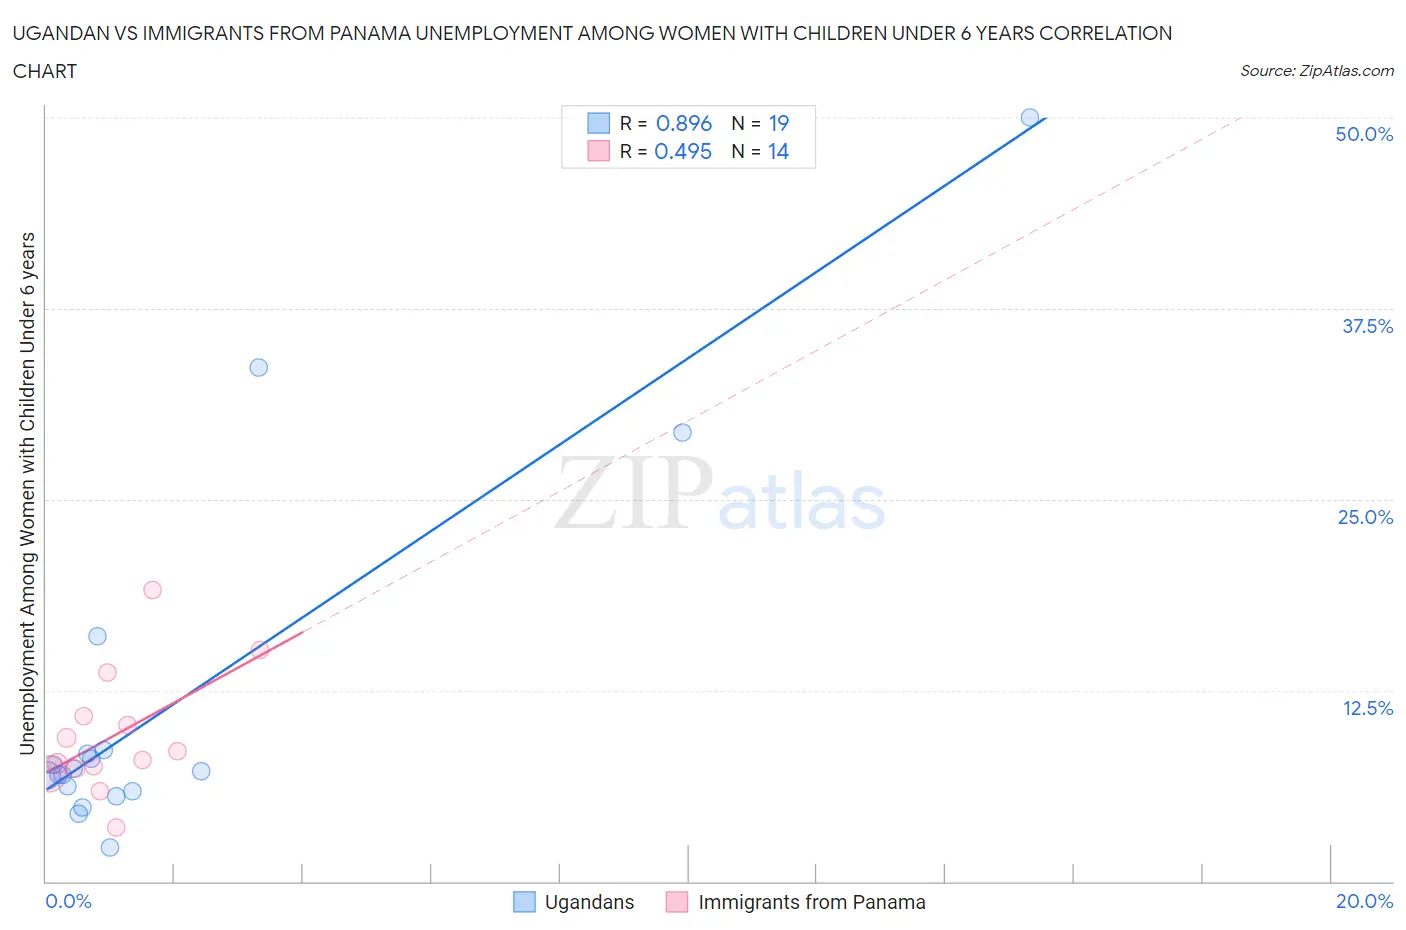
Ugandan vs Immigrants from Panama Unemployment Among Women with Children Under 6 years Correlation Chart
The statistical analysis conducted on geographies consisting of 86,756,193 people shows a very strong positive correlation between the proportion of Ugandans and unemployment rate among women with children under the age of 6 in the United States with a correlation coefficient (R) of 0.896 and weighted average of 7.6%. Similarly, the statistical analysis conducted on geographies consisting of 188,916,649 people shows a moderate positive correlation between the proportion of Immigrants from Panama and unemployment rate among women with children under the age of 6 in the United States with a correlation coefficient (R) of 0.495 and weighted average of 7.7%, a difference of 2.1%.
Unemployment Among Women with Children Under 6 years Correlation Summary
| Measurement | Ugandan | Immigrants from Panama |
| Minimum | 2.2% | 3.5% |
| Maximum | 50.0% | 19.1% |
| Range | 47.8% | 15.6% |
| Mean | 11.9% | 9.6% |
| Median | 7.2% | 8.2% |
| Interquartile 25% (IQ1) | 5.9% | 7.3% |
| Interquartile 75% (IQ3) | 8.6% | 10.8% |
| Interquartile Range (IQR) | 2.7% | 3.4% |
| Standard Deviation (Sample) | 12.3% | 4.0% |
| Standard Deviation (Population) | 12.0% | 3.9% |
Similar Demographics by Unemployment Among Women with Children Under 6 years
Demographics Similar to Ugandans by Unemployment Among Women with Children Under 6 years
In terms of unemployment among women with children under 6 years, the demographic groups most similar to Ugandans are Immigrants from South America (7.6%, a difference of 0.020%), British (7.6%, a difference of 0.040%), Belgian (7.6%, a difference of 0.17%), Immigrants from Lithuania (7.5%, a difference of 0.23%), and Kenyan (7.6%, a difference of 0.24%).
| Demographics | Rating | Rank | Unemployment Among Women with Children Under 6 years |
| Peruvians | 72.3 /100 | #157 | Good 7.5% |
| Croatians | 71.9 /100 | #158 | Good 7.5% |
| Immigrants | Philippines | 71.3 /100 | #159 | Good 7.5% |
| Bolivians | 70.8 /100 | #160 | Good 7.5% |
| Immigrants | Western Asia | 70.2 /100 | #161 | Good 7.5% |
| Immigrants | Lithuania | 68.8 /100 | #162 | Good 7.5% |
| British | 66.3 /100 | #163 | Good 7.6% |
| Ugandans | 65.8 /100 | #164 | Good 7.6% |
| Immigrants | South America | 65.6 /100 | #165 | Good 7.6% |
| Belgians | 63.5 /100 | #166 | Good 7.6% |
| Kenyans | 62.5 /100 | #167 | Good 7.6% |
| Immigrants | Canada | 61.6 /100 | #168 | Good 7.6% |
| Immigrants | Scotland | 61.3 /100 | #169 | Good 7.6% |
| Czechs | 59.8 /100 | #170 | Average 7.6% |
| Immigrants | Grenada | 59.0 /100 | #171 | Average 7.6% |
Demographics Similar to Immigrants from Panama by Unemployment Among Women with Children Under 6 years
In terms of unemployment among women with children under 6 years, the demographic groups most similar to Immigrants from Panama are Immigrants from North Macedonia (7.7%, a difference of 0.090%), Immigrants from Thailand (7.7%, a difference of 0.20%), Czechoslovakian (7.7%, a difference of 0.20%), Immigrants from Austria (7.7%, a difference of 0.24%), and Immigrants from Africa (7.7%, a difference of 0.24%).
| Demographics | Rating | Rank | Unemployment Among Women with Children Under 6 years |
| Nepalese | 43.5 /100 | #182 | Average 7.7% |
| Sierra Leoneans | 42.9 /100 | #183 | Average 7.7% |
| Indonesians | 40.5 /100 | #184 | Average 7.7% |
| Spanish Americans | 39.7 /100 | #185 | Fair 7.7% |
| Yugoslavians | 39.4 /100 | #186 | Fair 7.7% |
| Immigrants | Thailand | 38.5 /100 | #187 | Fair 7.7% |
| Czechoslovakians | 38.4 /100 | #188 | Fair 7.7% |
| Immigrants | Panama | 35.7 /100 | #189 | Fair 7.7% |
| Immigrants | North Macedonia | 34.4 /100 | #190 | Fair 7.7% |
| Immigrants | Austria | 32.4 /100 | #191 | Fair 7.7% |
| Immigrants | Africa | 32.4 /100 | #192 | Fair 7.7% |
| Slavs | 32.4 /100 | #193 | Fair 7.7% |
| Syrians | 31.9 /100 | #194 | Fair 7.7% |
| Malaysians | 31.1 /100 | #195 | Fair 7.7% |
| Immigrants | St. Vincent and the Grenadines | 31.1 /100 | #196 | Fair 7.7% |