Turkish vs Spanish American Associate's Degree
COMPARE
Turkish
Spanish American
Associate's Degree
Associate's Degree Comparison
Turks
Spanish Americans
53.9%
ASSOCIATE'S DEGREE
100.0/ 100
METRIC RATING
28th/ 347
METRIC RANK
41.8%
ASSOCIATE'S DEGREE
0.5/ 100
METRIC RATING
257th/ 347
METRIC RANK
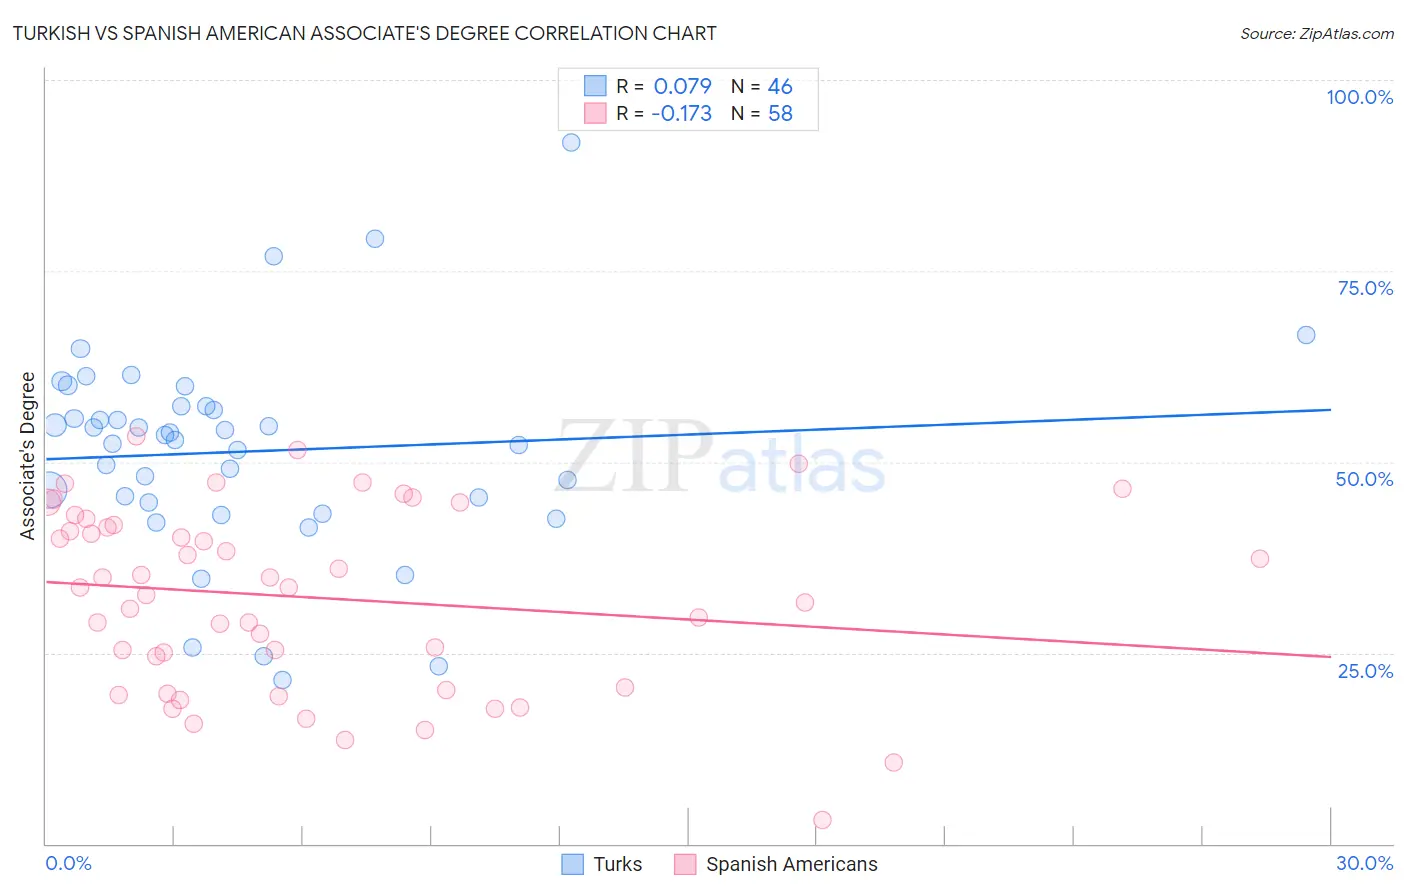
Turkish vs Spanish American Associate's Degree Correlation Chart
The statistical analysis conducted on geographies consisting of 271,852,708 people shows a slight positive correlation between the proportion of Turks and percentage of population with at least associate's degree education in the United States with a correlation coefficient (R) of 0.079 and weighted average of 53.9%. Similarly, the statistical analysis conducted on geographies consisting of 103,167,704 people shows a poor negative correlation between the proportion of Spanish Americans and percentage of population with at least associate's degree education in the United States with a correlation coefficient (R) of -0.173 and weighted average of 41.8%, a difference of 29.0%.
Associate's Degree Correlation Summary
| Measurement | Turkish | Spanish American |
| Minimum | 21.5% | 3.1% |
| Maximum | 91.9% | 53.4% |
| Range | 70.3% | 50.3% |
| Mean | 51.4% | 32.2% |
| Median | 53.2% | 33.5% |
| Interquartile 25% (IQ1) | 44.6% | 20.5% |
| Interquartile 75% (IQ3) | 57.2% | 41.7% |
| Interquartile Range (IQR) | 12.6% | 21.2% |
| Standard Deviation (Sample) | 13.6% | 11.9% |
| Standard Deviation (Population) | 13.4% | 11.8% |
Similar Demographics by Associate's Degree
Demographics Similar to Turks by Associate's Degree
In terms of associate's degree, the demographic groups most similar to Turks are Immigrants from France (53.9%, a difference of 0.010%), Latvian (53.9%, a difference of 0.070%), Immigrants from Sri Lanka (53.7%, a difference of 0.43%), Immigrants from Northern Europe (53.5%, a difference of 0.79%), and Immigrants from Turkey (53.4%, a difference of 0.82%).
| Demographics | Rating | Rank | Associate's Degree |
| Immigrants | Sweden | 100.0 /100 | #21 | Exceptional 54.6% |
| Immigrants | Japan | 100.0 /100 | #22 | Exceptional 54.6% |
| Burmese | 100.0 /100 | #23 | Exceptional 54.6% |
| Immigrants | Korea | 100.0 /100 | #24 | Exceptional 54.5% |
| Immigrants | Switzerland | 100.0 /100 | #25 | Exceptional 54.5% |
| Immigrants | Belgium | 100.0 /100 | #26 | Exceptional 54.5% |
| Latvians | 100.0 /100 | #27 | Exceptional 53.9% |
| Turks | 100.0 /100 | #28 | Exceptional 53.9% |
| Immigrants | France | 100.0 /100 | #29 | Exceptional 53.9% |
| Immigrants | Sri Lanka | 100.0 /100 | #30 | Exceptional 53.7% |
| Immigrants | Northern Europe | 100.0 /100 | #31 | Exceptional 53.5% |
| Immigrants | Turkey | 100.0 /100 | #32 | Exceptional 53.4% |
| Israelis | 100.0 /100 | #33 | Exceptional 53.4% |
| Bulgarians | 100.0 /100 | #34 | Exceptional 53.3% |
| Russians | 100.0 /100 | #35 | Exceptional 53.2% |
Demographics Similar to Spanish Americans by Associate's Degree
In terms of associate's degree, the demographic groups most similar to Spanish Americans are Immigrants from Congo (41.8%, a difference of 0.060%), Immigrants from Guyana (41.8%, a difference of 0.18%), Japanese (41.7%, a difference of 0.22%), Cuban (41.9%, a difference of 0.27%), and Malaysian (41.6%, a difference of 0.32%).
| Demographics | Rating | Rank | Associate's Degree |
| U.S. Virgin Islanders | 0.7 /100 | #250 | Tragic 42.1% |
| Immigrants | Bahamas | 0.7 /100 | #251 | Tragic 42.1% |
| French American Indians | 0.6 /100 | #252 | Tragic 42.0% |
| Indonesians | 0.6 /100 | #253 | Tragic 41.9% |
| Cubans | 0.6 /100 | #254 | Tragic 41.9% |
| Immigrants | Guyana | 0.5 /100 | #255 | Tragic 41.8% |
| Immigrants | Congo | 0.5 /100 | #256 | Tragic 41.8% |
| Spanish Americans | 0.5 /100 | #257 | Tragic 41.8% |
| Japanese | 0.5 /100 | #258 | Tragic 41.7% |
| Malaysians | 0.4 /100 | #259 | Tragic 41.6% |
| Marshallese | 0.4 /100 | #260 | Tragic 41.6% |
| Nicaraguans | 0.4 /100 | #261 | Tragic 41.5% |
| Bahamians | 0.4 /100 | #262 | Tragic 41.5% |
| Immigrants | Jamaica | 0.3 /100 | #263 | Tragic 41.5% |
| Osage | 0.3 /100 | #264 | Tragic 41.5% |