Turkish vs Immigrants from South Africa Associate's Degree
COMPARE
Turkish
Immigrants from South Africa
Associate's Degree
Associate's Degree Comparison
Turks
Immigrants from South Africa
53.9%
ASSOCIATE'S DEGREE
100.0/ 100
METRIC RATING
28th/ 347
METRIC RANK
52.5%
ASSOCIATE'S DEGREE
99.9/ 100
METRIC RATING
43rd/ 347
METRIC RANK
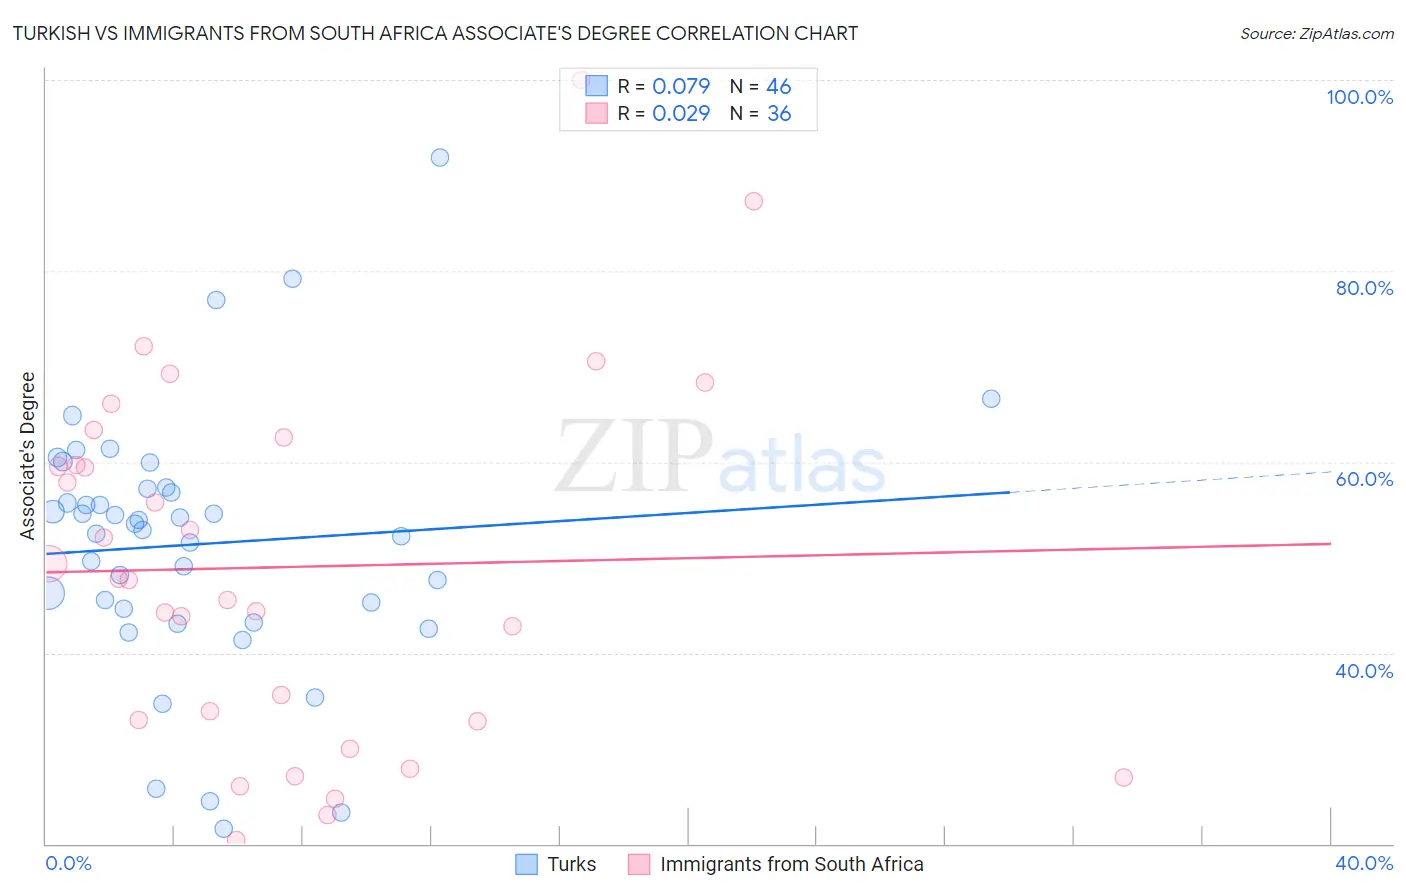
Turkish vs Immigrants from South Africa Associate's Degree Correlation Chart
The statistical analysis conducted on geographies consisting of 271,852,708 people shows a slight positive correlation between the proportion of Turks and percentage of population with at least associate's degree education in the United States with a correlation coefficient (R) of 0.079 and weighted average of 53.9%. Similarly, the statistical analysis conducted on geographies consisting of 233,315,008 people shows no correlation between the proportion of Immigrants from South Africa and percentage of population with at least associate's degree education in the United States with a correlation coefficient (R) of 0.029 and weighted average of 52.5%, a difference of 2.6%.
Associate's Degree Correlation Summary
| Measurement | Turkish | Immigrants from South Africa |
| Minimum | 21.5% | 20.4% |
| Maximum | 91.9% | 100.0% |
| Range | 70.3% | 79.6% |
| Mean | 51.4% | 49.0% |
| Median | 53.2% | 47.7% |
| Interquartile 25% (IQ1) | 44.6% | 32.9% |
| Interquartile 75% (IQ3) | 57.2% | 61.1% |
| Interquartile Range (IQR) | 12.6% | 28.1% |
| Standard Deviation (Sample) | 13.6% | 18.9% |
| Standard Deviation (Population) | 13.4% | 18.6% |
Demographics Similar to Turks and Immigrants from South Africa by Associate's Degree
In terms of associate's degree, the demographic groups most similar to Turks are Immigrants from France (53.9%, a difference of 0.010%), Latvian (53.9%, a difference of 0.070%), Immigrants from Sri Lanka (53.7%, a difference of 0.43%), Immigrants from Northern Europe (53.5%, a difference of 0.79%), and Immigrants from Turkey (53.4%, a difference of 0.82%). Similarly, the demographic groups most similar to Immigrants from South Africa are Immigrants from Malaysia (52.5%, a difference of 0.010%), Immigrants from Saudi Arabia (52.6%, a difference of 0.040%), Estonian (52.5%, a difference of 0.090%), Immigrants from Lithuania (52.4%, a difference of 0.16%), and Immigrants from Latvia (52.8%, a difference of 0.47%).
| Demographics | Rating | Rank | Associate's Degree |
| Immigrants | Switzerland | 100.0 /100 | #25 | Exceptional 54.5% |
| Immigrants | Belgium | 100.0 /100 | #26 | Exceptional 54.5% |
| Latvians | 100.0 /100 | #27 | Exceptional 53.9% |
| Turks | 100.0 /100 | #28 | Exceptional 53.9% |
| Immigrants | France | 100.0 /100 | #29 | Exceptional 53.9% |
| Immigrants | Sri Lanka | 100.0 /100 | #30 | Exceptional 53.7% |
| Immigrants | Northern Europe | 100.0 /100 | #31 | Exceptional 53.5% |
| Immigrants | Turkey | 100.0 /100 | #32 | Exceptional 53.4% |
| Israelis | 100.0 /100 | #33 | Exceptional 53.4% |
| Bulgarians | 100.0 /100 | #34 | Exceptional 53.3% |
| Russians | 100.0 /100 | #35 | Exceptional 53.2% |
| Immigrants | Russia | 100.0 /100 | #36 | Exceptional 53.1% |
| Immigrants | Denmark | 100.0 /100 | #37 | Exceptional 53.1% |
| Mongolians | 100.0 /100 | #38 | Exceptional 53.0% |
| Immigrants | Belarus | 99.9 /100 | #39 | Exceptional 52.8% |
| Immigrants | Latvia | 99.9 /100 | #40 | Exceptional 52.8% |
| Immigrants | Saudi Arabia | 99.9 /100 | #41 | Exceptional 52.6% |
| Immigrants | Malaysia | 99.9 /100 | #42 | Exceptional 52.5% |
| Immigrants | South Africa | 99.9 /100 | #43 | Exceptional 52.5% |
| Estonians | 99.9 /100 | #44 | Exceptional 52.5% |
| Immigrants | Lithuania | 99.9 /100 | #45 | Exceptional 52.4% |