Turkish vs Tohono O'odham Associate's Degree
COMPARE
Turkish
Tohono O'odham
Associate's Degree
Associate's Degree Comparison
Turks
Tohono O'odham
53.9%
ASSOCIATE'S DEGREE
100.0/ 100
METRIC RATING
28th/ 347
METRIC RANK
31.8%
ASSOCIATE'S DEGREE
0.0/ 100
METRIC RATING
343rd/ 347
METRIC RANK
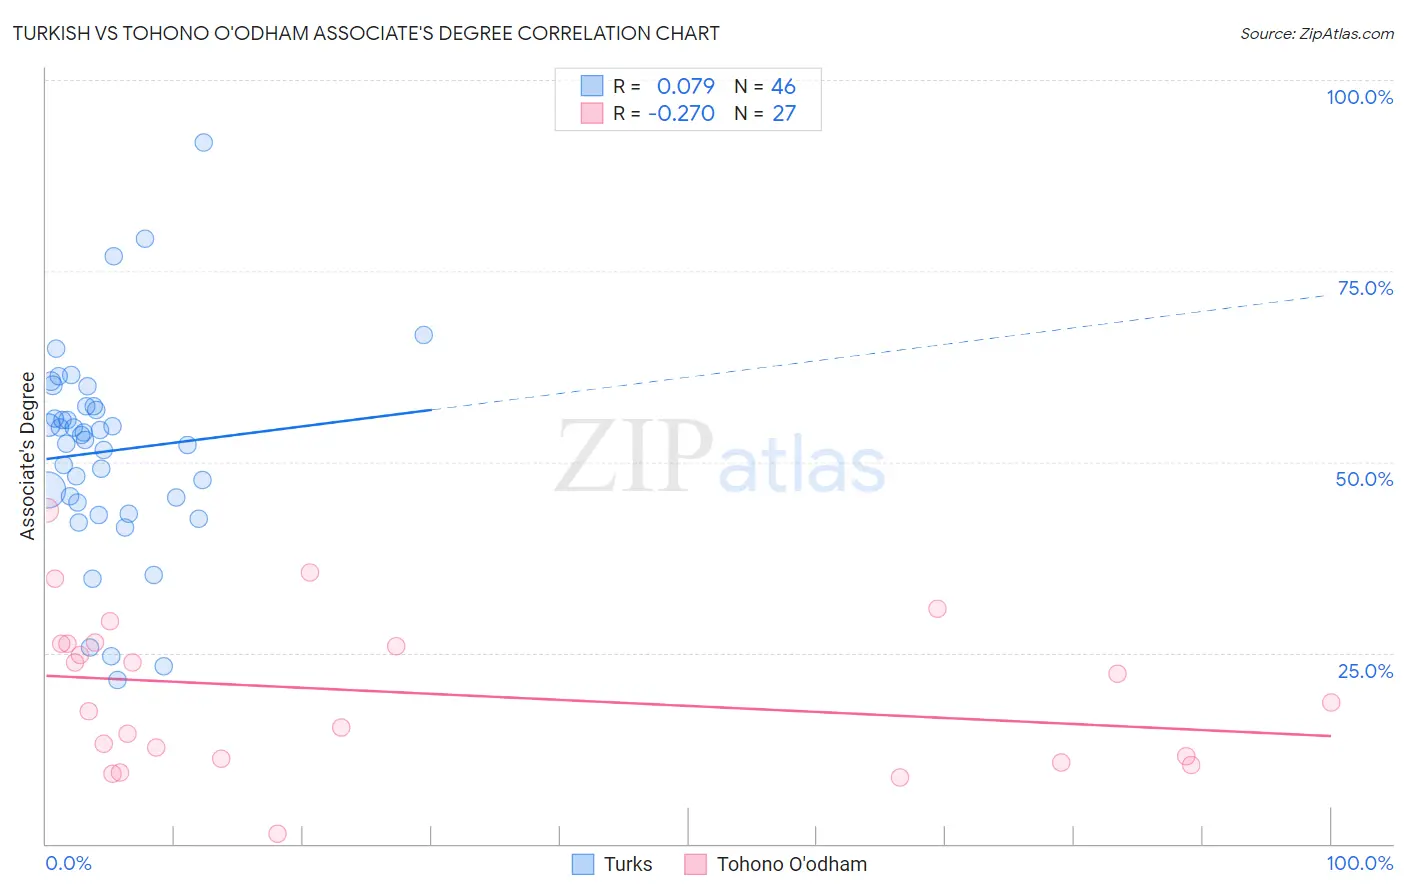
Turkish vs Tohono O'odham Associate's Degree Correlation Chart
The statistical analysis conducted on geographies consisting of 271,852,708 people shows a slight positive correlation between the proportion of Turks and percentage of population with at least associate's degree education in the United States with a correlation coefficient (R) of 0.079 and weighted average of 53.9%. Similarly, the statistical analysis conducted on geographies consisting of 58,725,971 people shows a weak negative correlation between the proportion of Tohono O'odham and percentage of population with at least associate's degree education in the United States with a correlation coefficient (R) of -0.270 and weighted average of 31.8%, a difference of 69.6%.
Associate's Degree Correlation Summary
| Measurement | Turkish | Tohono O'odham |
| Minimum | 21.5% | 1.3% |
| Maximum | 91.9% | 43.7% |
| Range | 70.3% | 42.4% |
| Mean | 51.4% | 19.8% |
| Median | 53.2% | 18.5% |
| Interquartile 25% (IQ1) | 44.6% | 11.2% |
| Interquartile 75% (IQ3) | 57.2% | 26.2% |
| Interquartile Range (IQR) | 12.6% | 15.1% |
| Standard Deviation (Sample) | 13.6% | 10.1% |
| Standard Deviation (Population) | 13.4% | 9.9% |
Similar Demographics by Associate's Degree
Demographics Similar to Turks by Associate's Degree
In terms of associate's degree, the demographic groups most similar to Turks are Immigrants from France (53.9%, a difference of 0.010%), Latvian (53.9%, a difference of 0.070%), Immigrants from Sri Lanka (53.7%, a difference of 0.43%), Immigrants from Northern Europe (53.5%, a difference of 0.79%), and Immigrants from Turkey (53.4%, a difference of 0.82%).
| Demographics | Rating | Rank | Associate's Degree |
| Immigrants | Sweden | 100.0 /100 | #21 | Exceptional 54.6% |
| Immigrants | Japan | 100.0 /100 | #22 | Exceptional 54.6% |
| Burmese | 100.0 /100 | #23 | Exceptional 54.6% |
| Immigrants | Korea | 100.0 /100 | #24 | Exceptional 54.5% |
| Immigrants | Switzerland | 100.0 /100 | #25 | Exceptional 54.5% |
| Immigrants | Belgium | 100.0 /100 | #26 | Exceptional 54.5% |
| Latvians | 100.0 /100 | #27 | Exceptional 53.9% |
| Turks | 100.0 /100 | #28 | Exceptional 53.9% |
| Immigrants | France | 100.0 /100 | #29 | Exceptional 53.9% |
| Immigrants | Sri Lanka | 100.0 /100 | #30 | Exceptional 53.7% |
| Immigrants | Northern Europe | 100.0 /100 | #31 | Exceptional 53.5% |
| Immigrants | Turkey | 100.0 /100 | #32 | Exceptional 53.4% |
| Israelis | 100.0 /100 | #33 | Exceptional 53.4% |
| Bulgarians | 100.0 /100 | #34 | Exceptional 53.3% |
| Russians | 100.0 /100 | #35 | Exceptional 53.2% |
Demographics Similar to Tohono O'odham by Associate's Degree
In terms of associate's degree, the demographic groups most similar to Tohono O'odham are Yuman (31.3%, a difference of 1.7%), Yakama (32.3%, a difference of 1.7%), Inupiat (32.6%, a difference of 2.5%), Navajo (32.6%, a difference of 2.5%), and Pima (30.2%, a difference of 5.1%).
| Demographics | Rating | Rank | Associate's Degree |
| Mexicans | 0.0 /100 | #333 | Tragic 35.0% |
| Natives/Alaskans | 0.0 /100 | #334 | Tragic 34.9% |
| Spanish American Indians | 0.0 /100 | #335 | Tragic 34.9% |
| Hopi | 0.0 /100 | #336 | Tragic 34.6% |
| Lumbee | 0.0 /100 | #337 | Tragic 34.1% |
| Pueblo | 0.0 /100 | #338 | Tragic 34.0% |
| Immigrants | Mexico | 0.0 /100 | #339 | Tragic 33.7% |
| Navajo | 0.0 /100 | #340 | Tragic 32.6% |
| Inupiat | 0.0 /100 | #341 | Tragic 32.6% |
| Yakama | 0.0 /100 | #342 | Tragic 32.3% |
| Tohono O'odham | 0.0 /100 | #343 | Tragic 31.8% |
| Yuman | 0.0 /100 | #344 | Tragic 31.3% |
| Pima | 0.0 /100 | #345 | Tragic 30.2% |
| Houma | 0.0 /100 | #346 | Tragic 28.2% |
| Yup'ik | 0.0 /100 | #347 | Tragic 25.0% |