Hungarian vs Immigrants from Jordan Associate's Degree
COMPARE
Hungarian
Immigrants from Jordan
Associate's Degree
Associate's Degree Comparison
Hungarians
Immigrants from Jordan
46.7%
ASSOCIATE'S DEGREE
59.3/ 100
METRIC RATING
166th/ 347
METRIC RANK
48.4%
ASSOCIATE'S DEGREE
91.2/ 100
METRIC RATING
130th/ 347
METRIC RANK
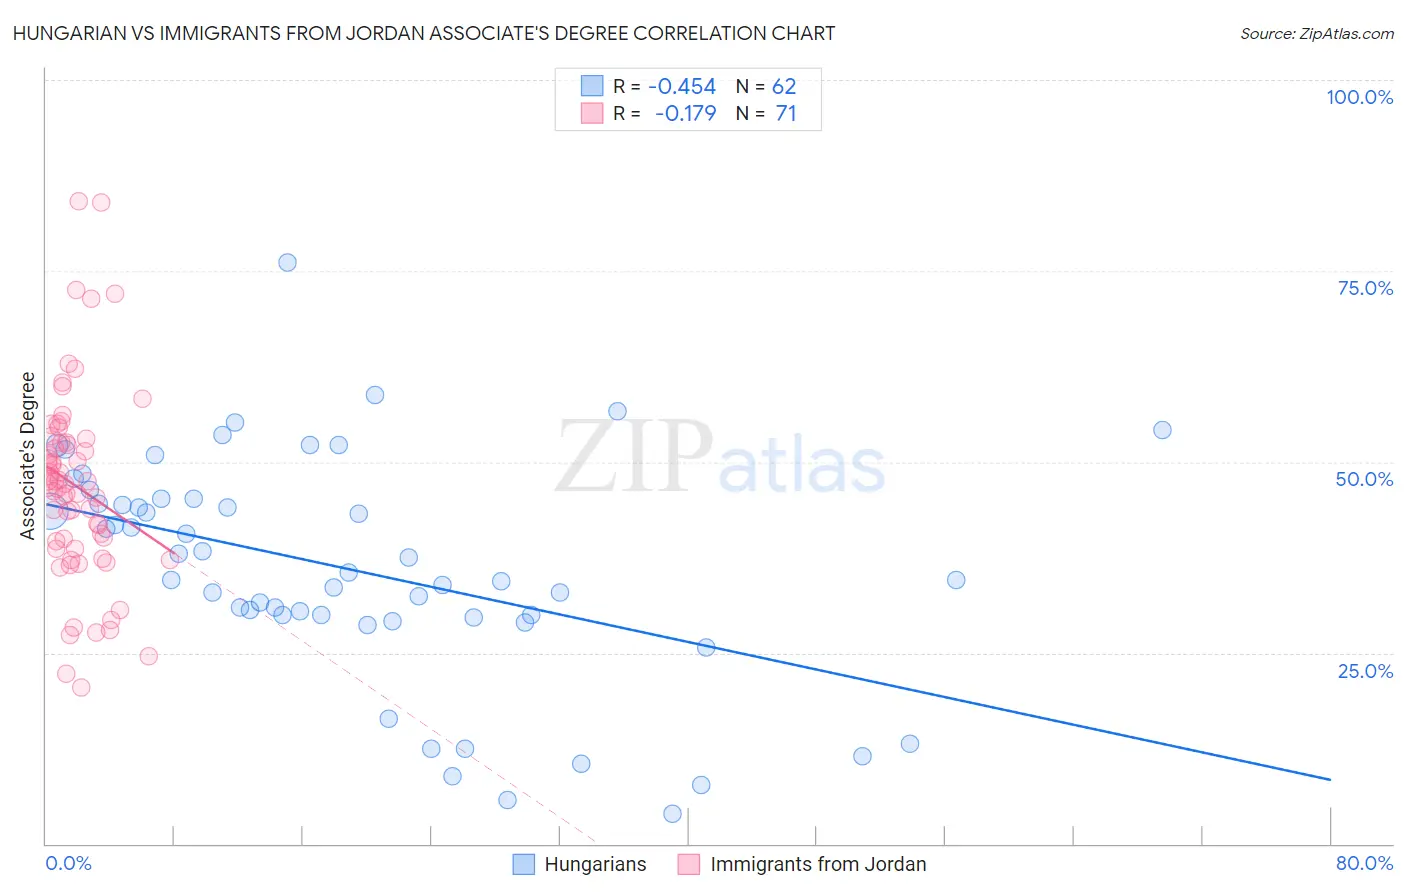
Hungarian vs Immigrants from Jordan Associate's Degree Correlation Chart
The statistical analysis conducted on geographies consisting of 486,216,105 people shows a moderate negative correlation between the proportion of Hungarians and percentage of population with at least associate's degree education in the United States with a correlation coefficient (R) of -0.454 and weighted average of 46.7%. Similarly, the statistical analysis conducted on geographies consisting of 181,277,239 people shows a poor negative correlation between the proportion of Immigrants from Jordan and percentage of population with at least associate's degree education in the United States with a correlation coefficient (R) of -0.179 and weighted average of 48.4%, a difference of 3.6%.
Associate's Degree Correlation Summary
| Measurement | Hungarian | Immigrants from Jordan |
| Minimum | 4.0% | 20.5% |
| Maximum | 76.2% | 84.2% |
| Range | 72.2% | 63.7% |
| Mean | 35.9% | 46.9% |
| Median | 35.0% | 47.1% |
| Interquartile 25% (IQ1) | 29.9% | 38.6% |
| Interquartile 75% (IQ3) | 45.2% | 52.6% |
| Interquartile Range (IQR) | 15.3% | 14.0% |
| Standard Deviation (Sample) | 14.7% | 12.7% |
| Standard Deviation (Population) | 14.6% | 12.6% |
Similar Demographics by Associate's Degree
Demographics Similar to Hungarians by Associate's Degree
In terms of associate's degree, the demographic groups most similar to Hungarians are Immigrants from Sierra Leone (46.7%, a difference of 0.010%), Immigrants from South America (46.7%, a difference of 0.040%), Colombian (46.8%, a difference of 0.24%), Somali (46.8%, a difference of 0.25%), and Immigrants from Somalia (46.5%, a difference of 0.29%).
| Demographics | Rating | Rank | Associate's Degree |
| Immigrants | Poland | 69.2 /100 | #159 | Good 47.1% |
| Scottish | 65.4 /100 | #160 | Good 46.9% |
| Scandinavians | 65.2 /100 | #161 | Good 46.9% |
| Immigrants | Africa | 63.2 /100 | #162 | Good 46.8% |
| Somalis | 62.5 /100 | #163 | Good 46.8% |
| Colombians | 62.4 /100 | #164 | Good 46.8% |
| Immigrants | South America | 59.9 /100 | #165 | Average 46.7% |
| Hungarians | 59.3 /100 | #166 | Average 46.7% |
| Immigrants | Sierra Leone | 59.2 /100 | #167 | Average 46.7% |
| Immigrants | Somalia | 55.5 /100 | #168 | Average 46.5% |
| Uruguayans | 55.4 /100 | #169 | Average 46.5% |
| Irish | 53.6 /100 | #170 | Average 46.5% |
| Basques | 52.8 /100 | #171 | Average 46.5% |
| Peruvians | 50.5 /100 | #172 | Average 46.4% |
| Immigrants | Iraq | 50.3 /100 | #173 | Average 46.4% |
Demographics Similar to Immigrants from Jordan by Associate's Degree
In terms of associate's degree, the demographic groups most similar to Immigrants from Jordan are Swedish (48.4%, a difference of 0.060%), Immigrants from Eastern Africa (48.4%, a difference of 0.090%), Icelander (48.3%, a difference of 0.10%), Immigrants from Uganda (48.5%, a difference of 0.21%), and Immigrants from Syria (48.5%, a difference of 0.22%).
| Demographics | Rating | Rank | Associate's Degree |
| Brazilians | 93.7 /100 | #123 | Exceptional 48.7% |
| Serbians | 92.6 /100 | #124 | Exceptional 48.5% |
| Chinese | 92.5 /100 | #125 | Exceptional 48.5% |
| Immigrants | Syria | 92.2 /100 | #126 | Exceptional 48.5% |
| Immigrants | Uganda | 92.1 /100 | #127 | Exceptional 48.5% |
| Immigrants | Eastern Africa | 91.6 /100 | #128 | Exceptional 48.4% |
| Swedes | 91.5 /100 | #129 | Exceptional 48.4% |
| Immigrants | Jordan | 91.2 /100 | #130 | Exceptional 48.4% |
| Icelanders | 90.8 /100 | #131 | Exceptional 48.3% |
| Immigrants | Albania | 89.9 /100 | #132 | Excellent 48.2% |
| Assyrians/Chaldeans/Syriacs | 89.4 /100 | #133 | Excellent 48.2% |
| Moroccans | 89.3 /100 | #134 | Excellent 48.2% |
| Europeans | 89.0 /100 | #135 | Excellent 48.2% |
| Pakistanis | 88.0 /100 | #136 | Excellent 48.1% |
| Immigrants | Eritrea | 87.8 /100 | #137 | Excellent 48.1% |