Fijian vs Immigrants from Jordan Associate's Degree
COMPARE
Fijian
Immigrants from Jordan
Associate's Degree
Associate's Degree Comparison
Fijians
Immigrants from Jordan
37.4%
ASSOCIATE'S DEGREE
0.0/ 100
METRIC RATING
319th/ 347
METRIC RANK
48.4%
ASSOCIATE'S DEGREE
91.2/ 100
METRIC RATING
130th/ 347
METRIC RANK
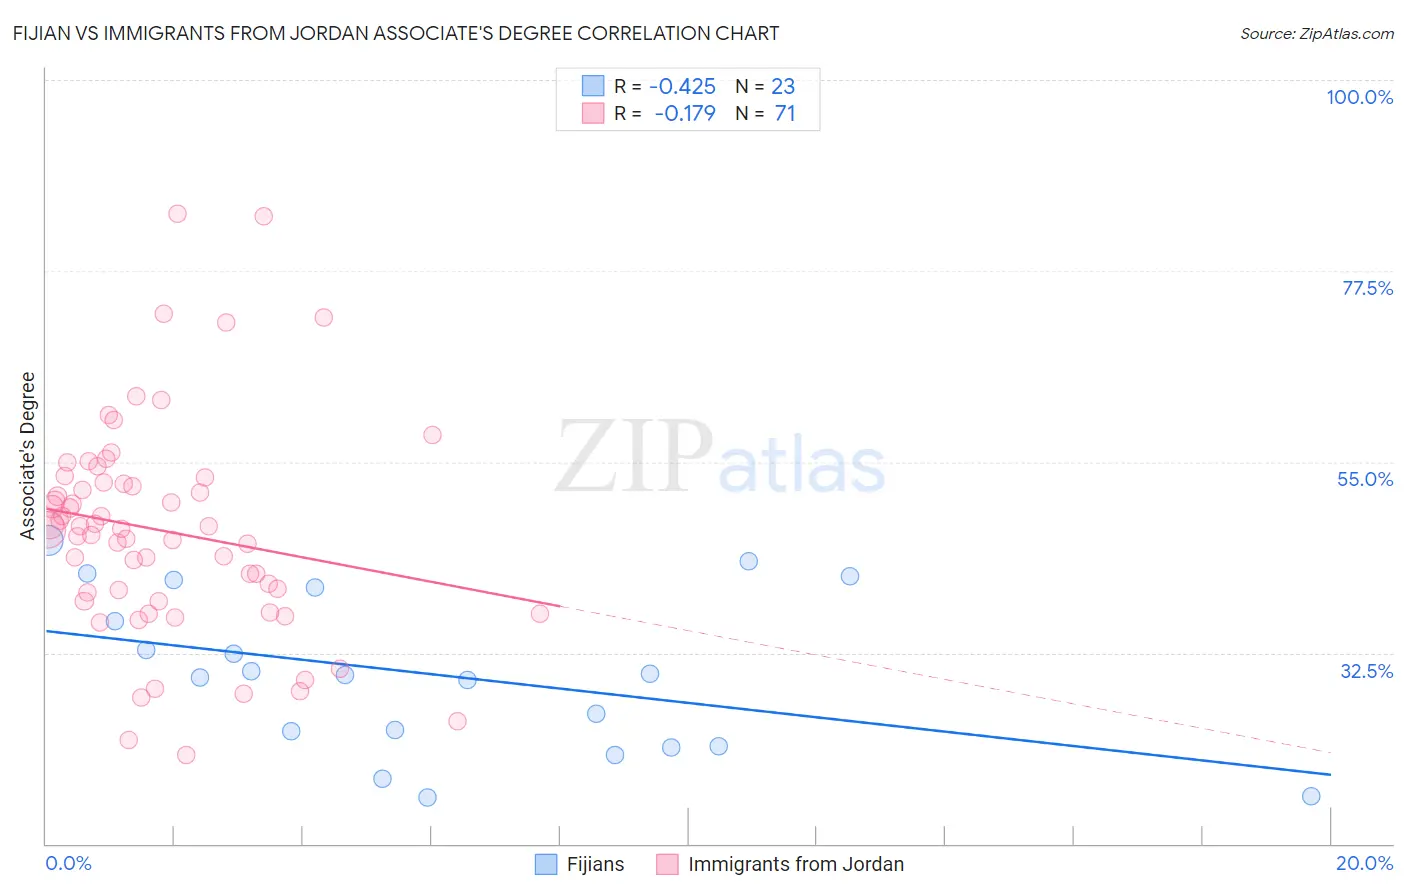
Fijian vs Immigrants from Jordan Associate's Degree Correlation Chart
The statistical analysis conducted on geographies consisting of 55,948,669 people shows a moderate negative correlation between the proportion of Fijians and percentage of population with at least associate's degree education in the United States with a correlation coefficient (R) of -0.425 and weighted average of 37.4%. Similarly, the statistical analysis conducted on geographies consisting of 181,277,239 people shows a poor negative correlation between the proportion of Immigrants from Jordan and percentage of population with at least associate's degree education in the United States with a correlation coefficient (R) of -0.179 and weighted average of 48.4%, a difference of 29.4%.
Associate's Degree Correlation Summary
| Measurement | Fijian | Immigrants from Jordan |
| Minimum | 15.4% | 20.5% |
| Maximum | 45.8% | 84.2% |
| Range | 30.4% | 63.7% |
| Mean | 29.9% | 46.9% |
| Median | 29.9% | 47.1% |
| Interquartile 25% (IQ1) | 21.5% | 38.6% |
| Interquartile 75% (IQ3) | 40.1% | 52.6% |
| Interquartile Range (IQR) | 18.7% | 14.0% |
| Standard Deviation (Sample) | 9.3% | 12.7% |
| Standard Deviation (Population) | 9.1% | 12.6% |
Similar Demographics by Associate's Degree
Demographics Similar to Fijians by Associate's Degree
In terms of associate's degree, the demographic groups most similar to Fijians are Cajun (37.4%, a difference of 0.030%), Immigrants from Yemen (37.3%, a difference of 0.15%), Alaska Native (37.5%, a difference of 0.22%), Pennsylvania German (37.2%, a difference of 0.43%), and Yaqui (37.6%, a difference of 0.45%).
| Demographics | Rating | Rank | Associate's Degree |
| Choctaw | 0.0 /100 | #312 | Tragic 37.8% |
| Hispanics or Latinos | 0.0 /100 | #313 | Tragic 37.7% |
| Seminole | 0.0 /100 | #314 | Tragic 37.7% |
| Creek | 0.0 /100 | #315 | Tragic 37.6% |
| Crow | 0.0 /100 | #316 | Tragic 37.6% |
| Yaqui | 0.0 /100 | #317 | Tragic 37.6% |
| Alaska Natives | 0.0 /100 | #318 | Tragic 37.5% |
| Fijians | 0.0 /100 | #319 | Tragic 37.4% |
| Cajuns | 0.0 /100 | #320 | Tragic 37.4% |
| Immigrants | Yemen | 0.0 /100 | #321 | Tragic 37.3% |
| Pennsylvania Germans | 0.0 /100 | #322 | Tragic 37.2% |
| Immigrants | Cabo Verde | 0.0 /100 | #323 | Tragic 36.8% |
| Arapaho | 0.0 /100 | #324 | Tragic 36.7% |
| Menominee | 0.0 /100 | #325 | Tragic 36.7% |
| Kiowa | 0.0 /100 | #326 | Tragic 36.5% |
Demographics Similar to Immigrants from Jordan by Associate's Degree
In terms of associate's degree, the demographic groups most similar to Immigrants from Jordan are Swedish (48.4%, a difference of 0.060%), Immigrants from Eastern Africa (48.4%, a difference of 0.090%), Icelander (48.3%, a difference of 0.10%), Immigrants from Uganda (48.5%, a difference of 0.21%), and Immigrants from Syria (48.5%, a difference of 0.22%).
| Demographics | Rating | Rank | Associate's Degree |
| Brazilians | 93.7 /100 | #123 | Exceptional 48.7% |
| Serbians | 92.6 /100 | #124 | Exceptional 48.5% |
| Chinese | 92.5 /100 | #125 | Exceptional 48.5% |
| Immigrants | Syria | 92.2 /100 | #126 | Exceptional 48.5% |
| Immigrants | Uganda | 92.1 /100 | #127 | Exceptional 48.5% |
| Immigrants | Eastern Africa | 91.6 /100 | #128 | Exceptional 48.4% |
| Swedes | 91.5 /100 | #129 | Exceptional 48.4% |
| Immigrants | Jordan | 91.2 /100 | #130 | Exceptional 48.4% |
| Icelanders | 90.8 /100 | #131 | Exceptional 48.3% |
| Immigrants | Albania | 89.9 /100 | #132 | Excellent 48.2% |
| Assyrians/Chaldeans/Syriacs | 89.4 /100 | #133 | Excellent 48.2% |
| Moroccans | 89.3 /100 | #134 | Excellent 48.2% |
| Europeans | 89.0 /100 | #135 | Excellent 48.2% |
| Pakistanis | 88.0 /100 | #136 | Excellent 48.1% |
| Immigrants | Eritrea | 87.8 /100 | #137 | Excellent 48.1% |