Chippewa vs Immigrants from Jordan Associate's Degree
COMPARE
Chippewa
Immigrants from Jordan
Associate's Degree
Associate's Degree Comparison
Chippewa
Immigrants from Jordan
40.7%
ASSOCIATE'S DEGREE
0.2/ 100
METRIC RATING
270th/ 347
METRIC RANK
48.4%
ASSOCIATE'S DEGREE
91.2/ 100
METRIC RATING
130th/ 347
METRIC RANK
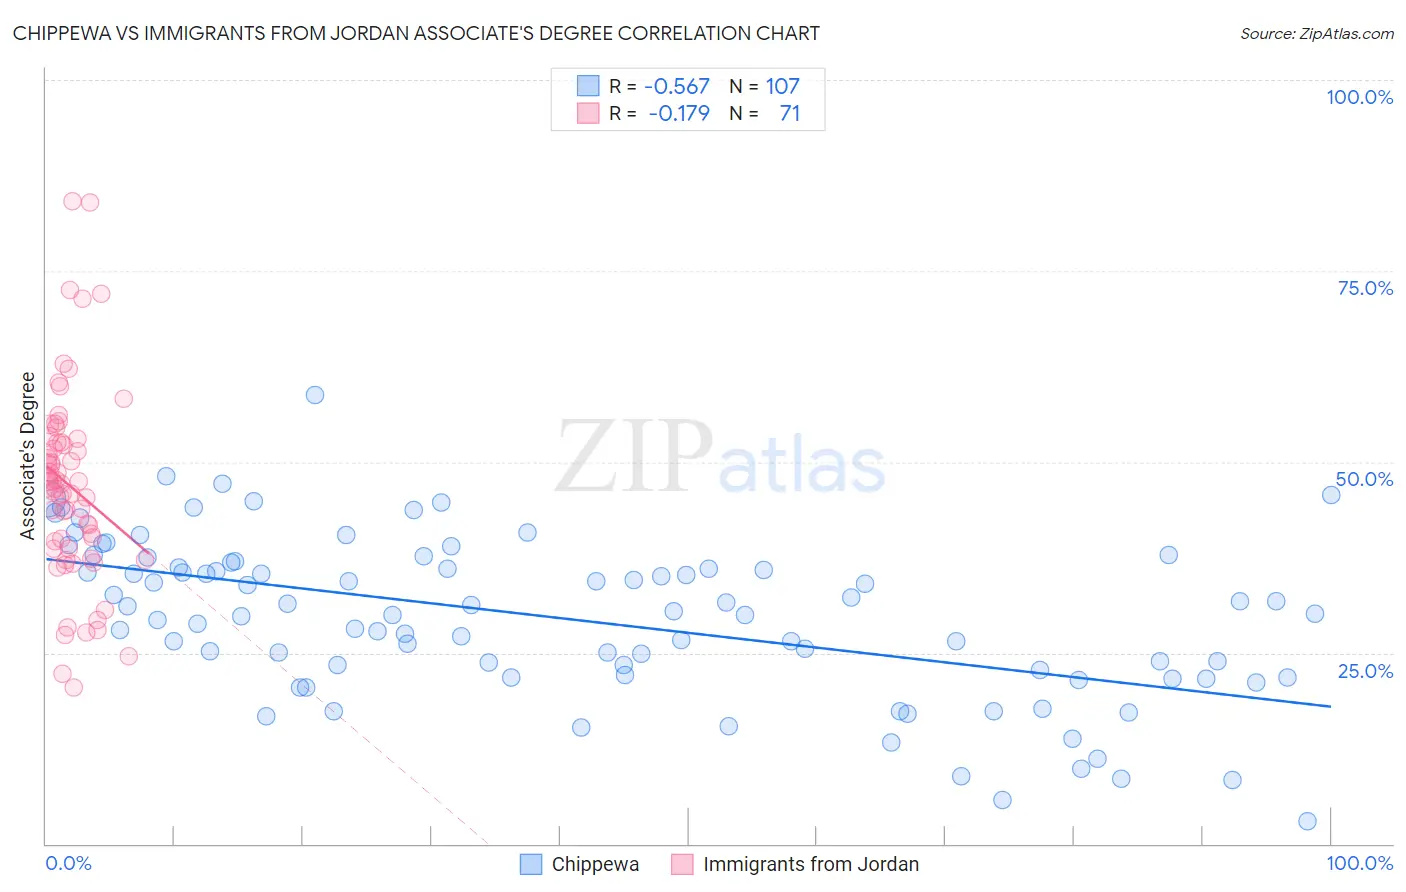
Chippewa vs Immigrants from Jordan Associate's Degree Correlation Chart
The statistical analysis conducted on geographies consisting of 215,061,498 people shows a substantial negative correlation between the proportion of Chippewa and percentage of population with at least associate's degree education in the United States with a correlation coefficient (R) of -0.567 and weighted average of 40.7%. Similarly, the statistical analysis conducted on geographies consisting of 181,277,239 people shows a poor negative correlation between the proportion of Immigrants from Jordan and percentage of population with at least associate's degree education in the United States with a correlation coefficient (R) of -0.179 and weighted average of 48.4%, a difference of 18.8%.
Associate's Degree Correlation Summary
| Measurement | Chippewa | Immigrants from Jordan |
| Minimum | 2.9% | 20.5% |
| Maximum | 58.7% | 84.2% |
| Range | 55.8% | 63.7% |
| Mean | 29.5% | 46.9% |
| Median | 30.2% | 47.1% |
| Interquartile 25% (IQ1) | 22.1% | 38.6% |
| Interquartile 75% (IQ3) | 36.2% | 52.6% |
| Interquartile Range (IQR) | 14.1% | 14.0% |
| Standard Deviation (Sample) | 10.5% | 12.7% |
| Standard Deviation (Population) | 10.4% | 12.6% |
Similar Demographics by Associate's Degree
Demographics Similar to Chippewa by Associate's Degree
In terms of associate's degree, the demographic groups most similar to Chippewa are American (40.8%, a difference of 0.050%), Immigrants from Laos (40.7%, a difference of 0.18%), Central American Indian (40.8%, a difference of 0.23%), Belizean (40.6%, a difference of 0.25%), and Hawaiian (40.9%, a difference of 0.42%).
| Demographics | Rating | Rank | Associate's Degree |
| Immigrants | Jamaica | 0.3 /100 | #263 | Tragic 41.5% |
| Osage | 0.3 /100 | #264 | Tragic 41.5% |
| Africans | 0.2 /100 | #265 | Tragic 41.1% |
| Samoans | 0.2 /100 | #266 | Tragic 41.1% |
| Hawaiians | 0.2 /100 | #267 | Tragic 40.9% |
| Central American Indians | 0.2 /100 | #268 | Tragic 40.8% |
| Americans | 0.2 /100 | #269 | Tragic 40.8% |
| Chippewa | 0.2 /100 | #270 | Tragic 40.7% |
| Immigrants | Laos | 0.1 /100 | #271 | Tragic 40.7% |
| Belizeans | 0.1 /100 | #272 | Tragic 40.6% |
| Puget Sound Salish | 0.1 /100 | #273 | Tragic 40.5% |
| Immigrants | Dominica | 0.1 /100 | #274 | Tragic 40.5% |
| Potawatomi | 0.1 /100 | #275 | Tragic 40.4% |
| Puerto Ricans | 0.1 /100 | #276 | Tragic 40.4% |
| Blackfeet | 0.1 /100 | #277 | Tragic 40.3% |
Demographics Similar to Immigrants from Jordan by Associate's Degree
In terms of associate's degree, the demographic groups most similar to Immigrants from Jordan are Swedish (48.4%, a difference of 0.060%), Immigrants from Eastern Africa (48.4%, a difference of 0.090%), Icelander (48.3%, a difference of 0.10%), Immigrants from Uganda (48.5%, a difference of 0.21%), and Immigrants from Syria (48.5%, a difference of 0.22%).
| Demographics | Rating | Rank | Associate's Degree |
| Brazilians | 93.7 /100 | #123 | Exceptional 48.7% |
| Serbians | 92.6 /100 | #124 | Exceptional 48.5% |
| Chinese | 92.5 /100 | #125 | Exceptional 48.5% |
| Immigrants | Syria | 92.2 /100 | #126 | Exceptional 48.5% |
| Immigrants | Uganda | 92.1 /100 | #127 | Exceptional 48.5% |
| Immigrants | Eastern Africa | 91.6 /100 | #128 | Exceptional 48.4% |
| Swedes | 91.5 /100 | #129 | Exceptional 48.4% |
| Immigrants | Jordan | 91.2 /100 | #130 | Exceptional 48.4% |
| Icelanders | 90.8 /100 | #131 | Exceptional 48.3% |
| Immigrants | Albania | 89.9 /100 | #132 | Excellent 48.2% |
| Assyrians/Chaldeans/Syriacs | 89.4 /100 | #133 | Excellent 48.2% |
| Moroccans | 89.3 /100 | #134 | Excellent 48.2% |
| Europeans | 89.0 /100 | #135 | Excellent 48.2% |
| Pakistanis | 88.0 /100 | #136 | Excellent 48.1% |
| Immigrants | Eritrea | 87.8 /100 | #137 | Excellent 48.1% |