Turkish vs Immigrants from Peru Associate's Degree
COMPARE
Turkish
Immigrants from Peru
Associate's Degree
Associate's Degree Comparison
Turks
Immigrants from Peru
53.9%
ASSOCIATE'S DEGREE
100.0/ 100
METRIC RATING
28th/ 347
METRIC RANK
45.5%
ASSOCIATE'S DEGREE
27.6/ 100
METRIC RATING
194th/ 347
METRIC RANK
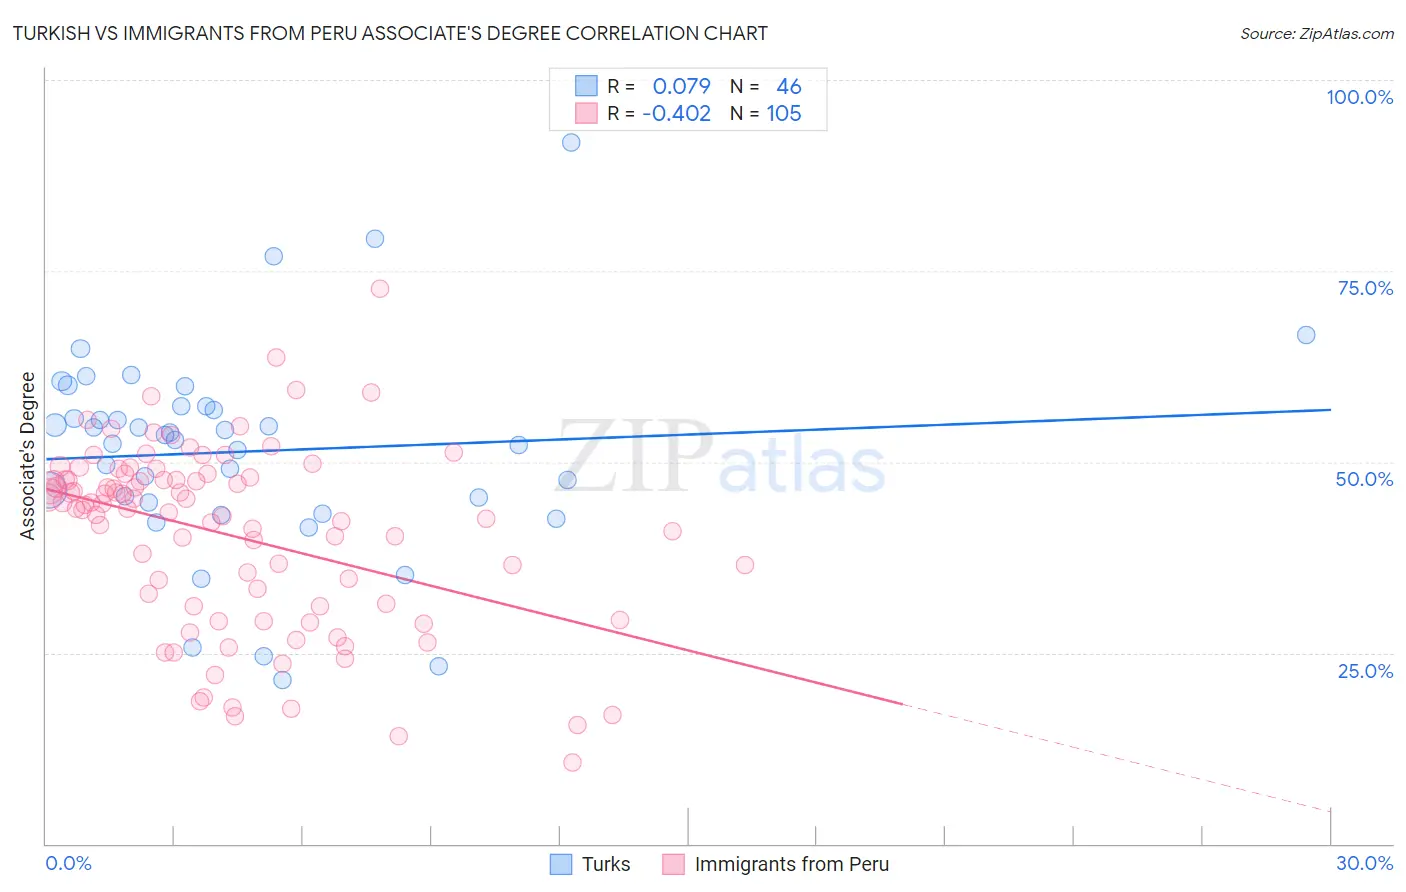
Turkish vs Immigrants from Peru Associate's Degree Correlation Chart
The statistical analysis conducted on geographies consisting of 271,852,708 people shows a slight positive correlation between the proportion of Turks and percentage of population with at least associate's degree education in the United States with a correlation coefficient (R) of 0.079 and weighted average of 53.9%. Similarly, the statistical analysis conducted on geographies consisting of 328,856,641 people shows a moderate negative correlation between the proportion of Immigrants from Peru and percentage of population with at least associate's degree education in the United States with a correlation coefficient (R) of -0.402 and weighted average of 45.5%, a difference of 18.4%.
Associate's Degree Correlation Summary
| Measurement | Turkish | Immigrants from Peru |
| Minimum | 21.5% | 10.6% |
| Maximum | 91.9% | 72.7% |
| Range | 70.3% | 62.1% |
| Mean | 51.4% | 40.4% |
| Median | 53.2% | 43.8% |
| Interquartile 25% (IQ1) | 44.6% | 31.2% |
| Interquartile 75% (IQ3) | 57.2% | 47.8% |
| Interquartile Range (IQR) | 12.6% | 16.6% |
| Standard Deviation (Sample) | 13.6% | 12.0% |
| Standard Deviation (Population) | 13.4% | 11.9% |
Similar Demographics by Associate's Degree
Demographics Similar to Turks by Associate's Degree
In terms of associate's degree, the demographic groups most similar to Turks are Immigrants from France (53.9%, a difference of 0.010%), Latvian (53.9%, a difference of 0.070%), Immigrants from Sri Lanka (53.7%, a difference of 0.43%), Immigrants from Northern Europe (53.5%, a difference of 0.79%), and Immigrants from Turkey (53.4%, a difference of 0.82%).
| Demographics | Rating | Rank | Associate's Degree |
| Immigrants | Sweden | 100.0 /100 | #21 | Exceptional 54.6% |
| Immigrants | Japan | 100.0 /100 | #22 | Exceptional 54.6% |
| Burmese | 100.0 /100 | #23 | Exceptional 54.6% |
| Immigrants | Korea | 100.0 /100 | #24 | Exceptional 54.5% |
| Immigrants | Switzerland | 100.0 /100 | #25 | Exceptional 54.5% |
| Immigrants | Belgium | 100.0 /100 | #26 | Exceptional 54.5% |
| Latvians | 100.0 /100 | #27 | Exceptional 53.9% |
| Turks | 100.0 /100 | #28 | Exceptional 53.9% |
| Immigrants | France | 100.0 /100 | #29 | Exceptional 53.9% |
| Immigrants | Sri Lanka | 100.0 /100 | #30 | Exceptional 53.7% |
| Immigrants | Northern Europe | 100.0 /100 | #31 | Exceptional 53.5% |
| Immigrants | Turkey | 100.0 /100 | #32 | Exceptional 53.4% |
| Israelis | 100.0 /100 | #33 | Exceptional 53.4% |
| Bulgarians | 100.0 /100 | #34 | Exceptional 53.3% |
| Russians | 100.0 /100 | #35 | Exceptional 53.2% |
Demographics Similar to Immigrants from Peru by Associate's Degree
In terms of associate's degree, the demographic groups most similar to Immigrants from Peru are German (45.5%, a difference of 0.10%), French (45.4%, a difference of 0.19%), Immigrants from Cameroon (45.7%, a difference of 0.32%), Celtic (45.8%, a difference of 0.51%), and Scotch-Irish (45.3%, a difference of 0.54%).
| Demographics | Rating | Rank | Associate's Degree |
| Immigrants | Uruguay | 35.5 /100 | #187 | Fair 45.8% |
| Ghanaians | 35.5 /100 | #188 | Fair 45.8% |
| Immigrants | Oceania | 34.7 /100 | #189 | Fair 45.8% |
| Vietnamese | 34.0 /100 | #190 | Fair 45.8% |
| Koreans | 33.8 /100 | #191 | Fair 45.8% |
| Celtics | 33.3 /100 | #192 | Fair 45.8% |
| Immigrants | Cameroon | 31.0 /100 | #193 | Fair 45.7% |
| Immigrants | Peru | 27.6 /100 | #194 | Fair 45.5% |
| Germans | 26.5 /100 | #195 | Fair 45.5% |
| French | 25.6 /100 | #196 | Fair 45.4% |
| Scotch-Irish | 22.3 /100 | #197 | Fair 45.3% |
| Immigrants | Bangladesh | 21.3 /100 | #198 | Fair 45.2% |
| Immigrants | Senegal | 21.2 /100 | #199 | Fair 45.2% |
| Senegalese | 21.1 /100 | #200 | Fair 45.2% |
| Immigrants | Vietnam | 20.8 /100 | #201 | Fair 45.2% |