Ute vs Immigrants from Jordan Associate's Degree
COMPARE
Ute
Immigrants from Jordan
Associate's Degree
Associate's Degree Comparison
Ute
Immigrants from Jordan
38.6%
ASSOCIATE'S DEGREE
0.0/ 100
METRIC RATING
299th/ 347
METRIC RANK
48.4%
ASSOCIATE'S DEGREE
91.2/ 100
METRIC RATING
130th/ 347
METRIC RANK
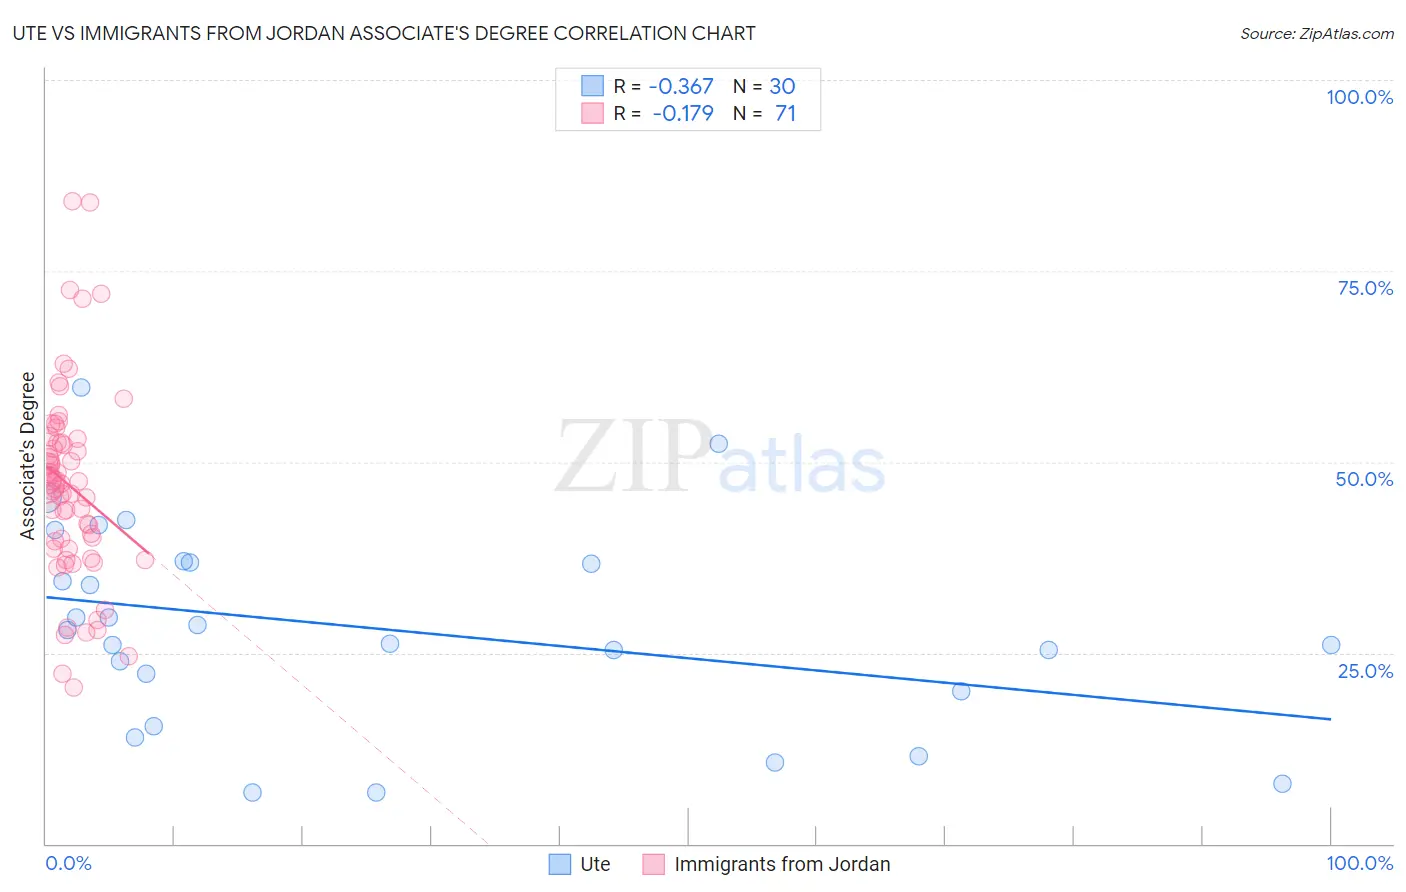
Ute vs Immigrants from Jordan Associate's Degree Correlation Chart
The statistical analysis conducted on geographies consisting of 55,668,197 people shows a mild negative correlation between the proportion of Ute and percentage of population with at least associate's degree education in the United States with a correlation coefficient (R) of -0.367 and weighted average of 38.6%. Similarly, the statistical analysis conducted on geographies consisting of 181,277,239 people shows a poor negative correlation between the proportion of Immigrants from Jordan and percentage of population with at least associate's degree education in the United States with a correlation coefficient (R) of -0.179 and weighted average of 48.4%, a difference of 25.3%.
Associate's Degree Correlation Summary
| Measurement | Ute | Immigrants from Jordan |
| Minimum | 6.7% | 20.5% |
| Maximum | 59.8% | 84.2% |
| Range | 53.1% | 63.7% |
| Mean | 28.2% | 46.9% |
| Median | 27.1% | 47.1% |
| Interquartile 25% (IQ1) | 20.0% | 38.6% |
| Interquartile 75% (IQ3) | 36.8% | 52.6% |
| Interquartile Range (IQR) | 16.8% | 14.0% |
| Standard Deviation (Sample) | 13.3% | 12.7% |
| Standard Deviation (Population) | 13.1% | 12.6% |
Similar Demographics by Associate's Degree
Demographics Similar to Ute by Associate's Degree
In terms of associate's degree, the demographic groups most similar to Ute are Chickasaw (38.6%, a difference of 0.040%), Cheyenne (38.7%, a difference of 0.090%), Tsimshian (38.6%, a difference of 0.090%), Colville (38.5%, a difference of 0.24%), and Guatemalan (38.5%, a difference of 0.33%).
| Demographics | Rating | Rank | Associate's Degree |
| Blacks/African Americans | 0.0 /100 | #292 | Tragic 39.1% |
| Nepalese | 0.0 /100 | #293 | Tragic 39.0% |
| Salvadorans | 0.0 /100 | #294 | Tragic 39.0% |
| Hondurans | 0.0 /100 | #295 | Tragic 38.9% |
| Cherokee | 0.0 /100 | #296 | Tragic 38.9% |
| Cape Verdeans | 0.0 /100 | #297 | Tragic 38.8% |
| Cheyenne | 0.0 /100 | #298 | Tragic 38.7% |
| Ute | 0.0 /100 | #299 | Tragic 38.6% |
| Chickasaw | 0.0 /100 | #300 | Tragic 38.6% |
| Tsimshian | 0.0 /100 | #301 | Tragic 38.6% |
| Colville | 0.0 /100 | #302 | Tragic 38.5% |
| Guatemalans | 0.0 /100 | #303 | Tragic 38.5% |
| Sioux | 0.0 /100 | #304 | Tragic 38.5% |
| Immigrants | Honduras | 0.0 /100 | #305 | Tragic 38.5% |
| Shoshone | 0.0 /100 | #306 | Tragic 38.4% |
Demographics Similar to Immigrants from Jordan by Associate's Degree
In terms of associate's degree, the demographic groups most similar to Immigrants from Jordan are Swedish (48.4%, a difference of 0.060%), Immigrants from Eastern Africa (48.4%, a difference of 0.090%), Icelander (48.3%, a difference of 0.10%), Immigrants from Uganda (48.5%, a difference of 0.21%), and Immigrants from Syria (48.5%, a difference of 0.22%).
| Demographics | Rating | Rank | Associate's Degree |
| Brazilians | 93.7 /100 | #123 | Exceptional 48.7% |
| Serbians | 92.6 /100 | #124 | Exceptional 48.5% |
| Chinese | 92.5 /100 | #125 | Exceptional 48.5% |
| Immigrants | Syria | 92.2 /100 | #126 | Exceptional 48.5% |
| Immigrants | Uganda | 92.1 /100 | #127 | Exceptional 48.5% |
| Immigrants | Eastern Africa | 91.6 /100 | #128 | Exceptional 48.4% |
| Swedes | 91.5 /100 | #129 | Exceptional 48.4% |
| Immigrants | Jordan | 91.2 /100 | #130 | Exceptional 48.4% |
| Icelanders | 90.8 /100 | #131 | Exceptional 48.3% |
| Immigrants | Albania | 89.9 /100 | #132 | Excellent 48.2% |
| Assyrians/Chaldeans/Syriacs | 89.4 /100 | #133 | Excellent 48.2% |
| Moroccans | 89.3 /100 | #134 | Excellent 48.2% |
| Europeans | 89.0 /100 | #135 | Excellent 48.2% |
| Pakistanis | 88.0 /100 | #136 | Excellent 48.1% |
| Immigrants | Eritrea | 87.8 /100 | #137 | Excellent 48.1% |