Turkish vs Immigrants from Iran Associate's Degree
COMPARE
Turkish
Immigrants from Iran
Associate's Degree
Associate's Degree Comparison
Turks
Immigrants from Iran
53.9%
ASSOCIATE'S DEGREE
100.0/ 100
METRIC RATING
28th/ 347
METRIC RANK
57.7%
ASSOCIATE'S DEGREE
100.0/ 100
METRIC RATING
7th/ 347
METRIC RANK
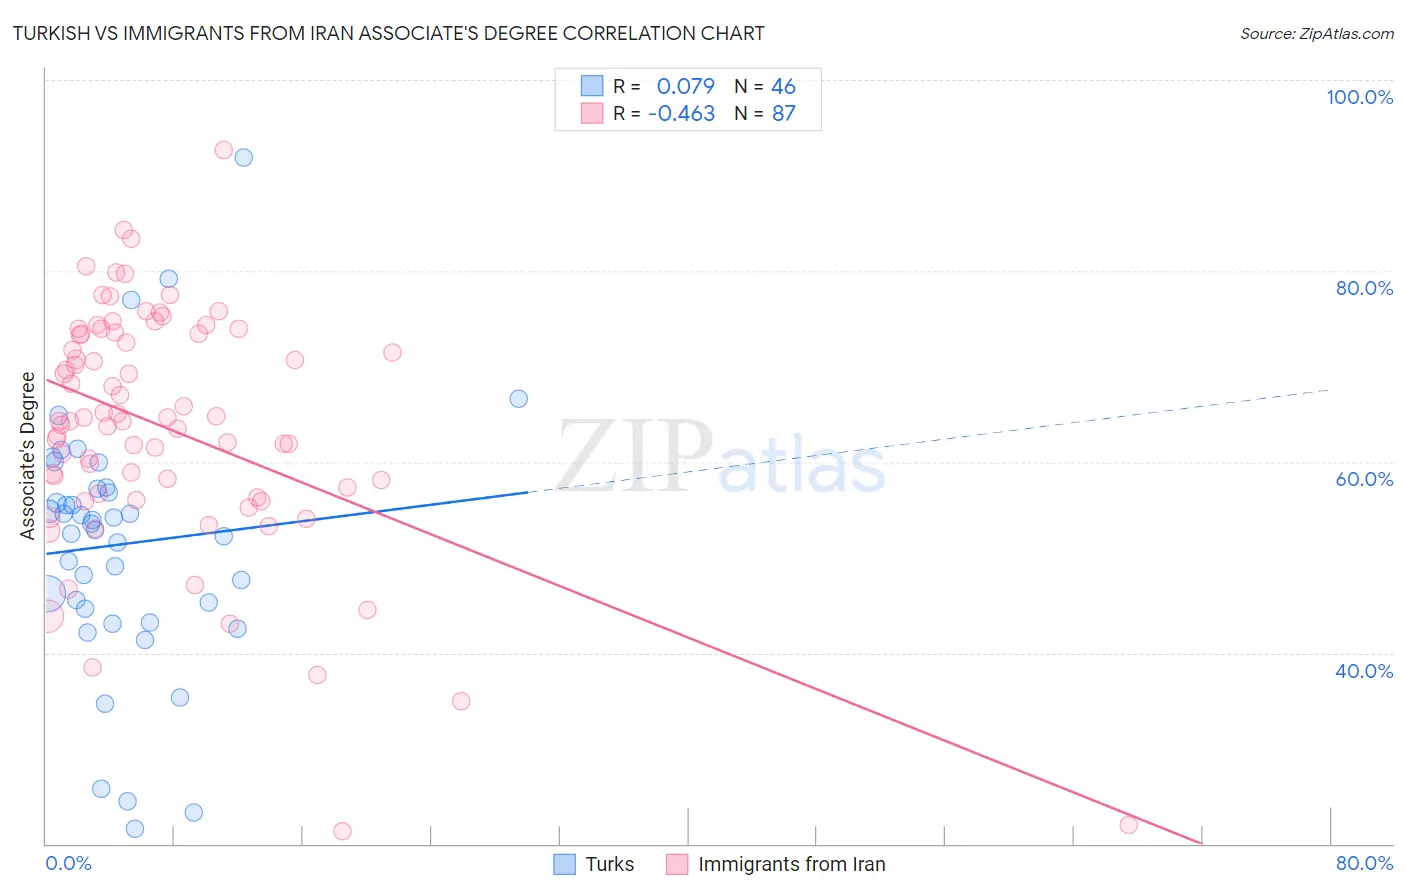
Turkish vs Immigrants from Iran Associate's Degree Correlation Chart
The statistical analysis conducted on geographies consisting of 271,852,708 people shows a slight positive correlation between the proportion of Turks and percentage of population with at least associate's degree education in the United States with a correlation coefficient (R) of 0.079 and weighted average of 53.9%. Similarly, the statistical analysis conducted on geographies consisting of 279,901,674 people shows a moderate negative correlation between the proportion of Immigrants from Iran and percentage of population with at least associate's degree education in the United States with a correlation coefficient (R) of -0.463 and weighted average of 57.7%, a difference of 7.0%.
Associate's Degree Correlation Summary
| Measurement | Turkish | Immigrants from Iran |
| Minimum | 21.5% | 21.3% |
| Maximum | 91.9% | 92.6% |
| Range | 70.3% | 71.3% |
| Mean | 51.4% | 63.6% |
| Median | 53.2% | 64.3% |
| Interquartile 25% (IQ1) | 44.6% | 56.7% |
| Interquartile 75% (IQ3) | 57.2% | 73.4% |
| Interquartile Range (IQR) | 12.6% | 16.8% |
| Standard Deviation (Sample) | 13.6% | 12.7% |
| Standard Deviation (Population) | 13.4% | 12.7% |
Similar Demographics by Associate's Degree
Demographics Similar to Turks by Associate's Degree
In terms of associate's degree, the demographic groups most similar to Turks are Immigrants from France (53.9%, a difference of 0.010%), Latvian (53.9%, a difference of 0.070%), Immigrants from Sri Lanka (53.7%, a difference of 0.43%), Immigrants from Northern Europe (53.5%, a difference of 0.79%), and Immigrants from Turkey (53.4%, a difference of 0.82%).
| Demographics | Rating | Rank | Associate's Degree |
| Immigrants | Sweden | 100.0 /100 | #21 | Exceptional 54.6% |
| Immigrants | Japan | 100.0 /100 | #22 | Exceptional 54.6% |
| Burmese | 100.0 /100 | #23 | Exceptional 54.6% |
| Immigrants | Korea | 100.0 /100 | #24 | Exceptional 54.5% |
| Immigrants | Switzerland | 100.0 /100 | #25 | Exceptional 54.5% |
| Immigrants | Belgium | 100.0 /100 | #26 | Exceptional 54.5% |
| Latvians | 100.0 /100 | #27 | Exceptional 53.9% |
| Turks | 100.0 /100 | #28 | Exceptional 53.9% |
| Immigrants | France | 100.0 /100 | #29 | Exceptional 53.9% |
| Immigrants | Sri Lanka | 100.0 /100 | #30 | Exceptional 53.7% |
| Immigrants | Northern Europe | 100.0 /100 | #31 | Exceptional 53.5% |
| Immigrants | Turkey | 100.0 /100 | #32 | Exceptional 53.4% |
| Israelis | 100.0 /100 | #33 | Exceptional 53.4% |
| Bulgarians | 100.0 /100 | #34 | Exceptional 53.3% |
| Russians | 100.0 /100 | #35 | Exceptional 53.2% |
Demographics Similar to Immigrants from Iran by Associate's Degree
In terms of associate's degree, the demographic groups most similar to Immigrants from Iran are Okinawan (57.7%, a difference of 0.060%), Thai (57.4%, a difference of 0.40%), Iranian (58.2%, a difference of 0.89%), Immigrants from Taiwan (58.4%, a difference of 1.3%), and Immigrants from Israel (56.8%, a difference of 1.5%).
| Demographics | Rating | Rank | Associate's Degree |
| Filipinos | 100.0 /100 | #1 | Exceptional 59.8% |
| Immigrants | Singapore | 100.0 /100 | #2 | Exceptional 58.9% |
| Immigrants | India | 100.0 /100 | #3 | Exceptional 58.5% |
| Immigrants | Taiwan | 100.0 /100 | #4 | Exceptional 58.4% |
| Iranians | 100.0 /100 | #5 | Exceptional 58.2% |
| Okinawans | 100.0 /100 | #6 | Exceptional 57.7% |
| Immigrants | Iran | 100.0 /100 | #7 | Exceptional 57.7% |
| Thais | 100.0 /100 | #8 | Exceptional 57.4% |
| Immigrants | Israel | 100.0 /100 | #9 | Exceptional 56.8% |
| Cypriots | 100.0 /100 | #10 | Exceptional 56.4% |
| Immigrants | Australia | 100.0 /100 | #11 | Exceptional 55.8% |
| Immigrants | South Central Asia | 100.0 /100 | #12 | Exceptional 55.7% |
| Immigrants | China | 100.0 /100 | #13 | Exceptional 55.5% |
| Immigrants | Hong Kong | 100.0 /100 | #14 | Exceptional 55.4% |
| Immigrants | Eastern Asia | 100.0 /100 | #15 | Exceptional 55.4% |