Turkish vs Cree Associate's Degree
COMPARE
Turkish
Cree
Associate's Degree
Associate's Degree Comparison
Turks
Cree
53.9%
ASSOCIATE'S DEGREE
100.0/ 100
METRIC RATING
28th/ 347
METRIC RANK
42.5%
ASSOCIATE'S DEGREE
1.2/ 100
METRIC RATING
240th/ 347
METRIC RANK
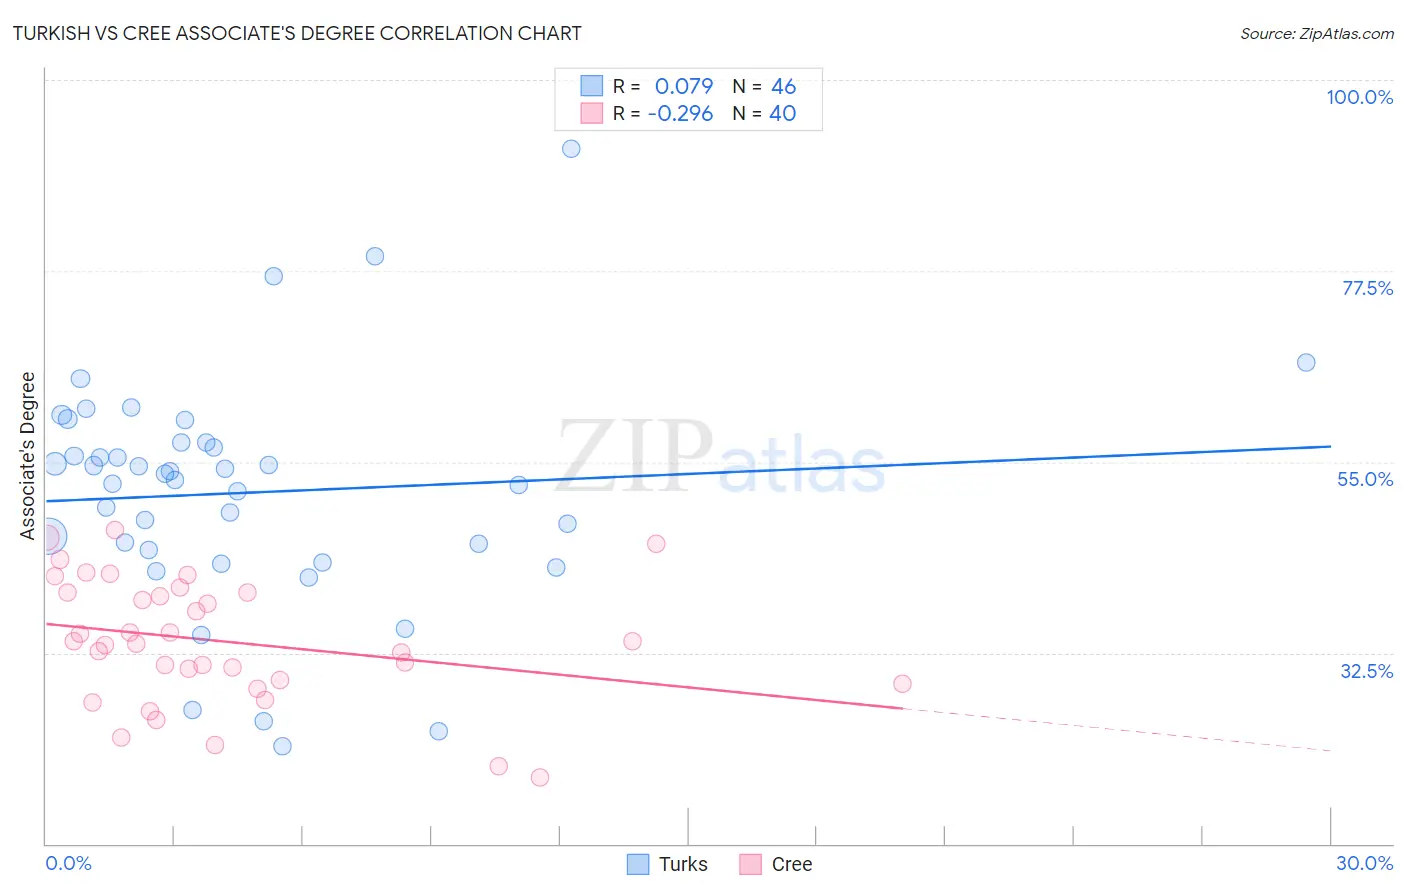
Turkish vs Cree Associate's Degree Correlation Chart
The statistical analysis conducted on geographies consisting of 271,852,708 people shows a slight positive correlation between the proportion of Turks and percentage of population with at least associate's degree education in the United States with a correlation coefficient (R) of 0.079 and weighted average of 53.9%. Similarly, the statistical analysis conducted on geographies consisting of 76,211,414 people shows a weak negative correlation between the proportion of Cree and percentage of population with at least associate's degree education in the United States with a correlation coefficient (R) of -0.296 and weighted average of 42.5%, a difference of 26.7%.
Associate's Degree Correlation Summary
| Measurement | Turkish | Cree |
| Minimum | 21.5% | 17.8% |
| Maximum | 91.9% | 46.9% |
| Range | 70.3% | 29.1% |
| Mean | 51.4% | 33.8% |
| Median | 53.2% | 33.7% |
| Interquartile 25% (IQ1) | 44.6% | 29.1% |
| Interquartile 75% (IQ3) | 57.2% | 39.6% |
| Interquartile Range (IQR) | 12.6% | 10.6% |
| Standard Deviation (Sample) | 13.6% | 7.4% |
| Standard Deviation (Population) | 13.4% | 7.3% |
Similar Demographics by Associate's Degree
Demographics Similar to Turks by Associate's Degree
In terms of associate's degree, the demographic groups most similar to Turks are Immigrants from France (53.9%, a difference of 0.010%), Latvian (53.9%, a difference of 0.070%), Immigrants from Sri Lanka (53.7%, a difference of 0.43%), Immigrants from Northern Europe (53.5%, a difference of 0.79%), and Immigrants from Turkey (53.4%, a difference of 0.82%).
| Demographics | Rating | Rank | Associate's Degree |
| Immigrants | Sweden | 100.0 /100 | #21 | Exceptional 54.6% |
| Immigrants | Japan | 100.0 /100 | #22 | Exceptional 54.6% |
| Burmese | 100.0 /100 | #23 | Exceptional 54.6% |
| Immigrants | Korea | 100.0 /100 | #24 | Exceptional 54.5% |
| Immigrants | Switzerland | 100.0 /100 | #25 | Exceptional 54.5% |
| Immigrants | Belgium | 100.0 /100 | #26 | Exceptional 54.5% |
| Latvians | 100.0 /100 | #27 | Exceptional 53.9% |
| Turks | 100.0 /100 | #28 | Exceptional 53.9% |
| Immigrants | France | 100.0 /100 | #29 | Exceptional 53.9% |
| Immigrants | Sri Lanka | 100.0 /100 | #30 | Exceptional 53.7% |
| Immigrants | Northern Europe | 100.0 /100 | #31 | Exceptional 53.5% |
| Immigrants | Turkey | 100.0 /100 | #32 | Exceptional 53.4% |
| Israelis | 100.0 /100 | #33 | Exceptional 53.4% |
| Bulgarians | 100.0 /100 | #34 | Exceptional 53.3% |
| Russians | 100.0 /100 | #35 | Exceptional 53.2% |
Demographics Similar to Cree by Associate's Degree
In terms of associate's degree, the demographic groups most similar to Cree are Immigrants from Grenada (42.6%, a difference of 0.18%), British West Indian (42.4%, a difference of 0.33%), Immigrants from West Indies (42.4%, a difference of 0.34%), Guyanese (42.3%, a difference of 0.45%), and Immigrants from Liberia (42.3%, a difference of 0.59%).
| Demographics | Rating | Rank | Associate's Degree |
| Tongans | 2.2 /100 | #233 | Tragic 43.0% |
| Tlingit-Haida | 2.1 /100 | #234 | Tragic 43.0% |
| Ecuadorians | 2.0 /100 | #235 | Tragic 43.0% |
| Immigrants | St. Vincent and the Grenadines | 1.9 /100 | #236 | Tragic 42.9% |
| Immigrants | Nonimmigrants | 1.9 /100 | #237 | Tragic 42.9% |
| Iroquois | 1.7 /100 | #238 | Tragic 42.8% |
| Immigrants | Grenada | 1.3 /100 | #239 | Tragic 42.6% |
| Cree | 1.2 /100 | #240 | Tragic 42.5% |
| British West Indians | 1.0 /100 | #241 | Tragic 42.4% |
| Immigrants | West Indies | 1.0 /100 | #242 | Tragic 42.4% |
| Guyanese | 1.0 /100 | #243 | Tragic 42.3% |
| Immigrants | Liberia | 0.9 /100 | #244 | Tragic 42.3% |
| Immigrants | Cambodia | 0.9 /100 | #245 | Tragic 42.3% |
| Delaware | 0.9 /100 | #246 | Tragic 42.3% |
| Immigrants | Fiji | 0.8 /100 | #247 | Tragic 42.2% |