Subsaharan African vs Immigrants from Scotland GED/Equivalency
COMPARE
Subsaharan African
Immigrants from Scotland
GED/Equivalency
GED/Equivalency Comparison
Sub-Saharan Africans
Immigrants from Scotland
84.2%
GED/EQUIVALENCY
3.0/ 100
METRIC RATING
237th/ 347
METRIC RANK
88.2%
GED/EQUIVALENCY
99.6/ 100
METRIC RATING
43rd/ 347
METRIC RANK
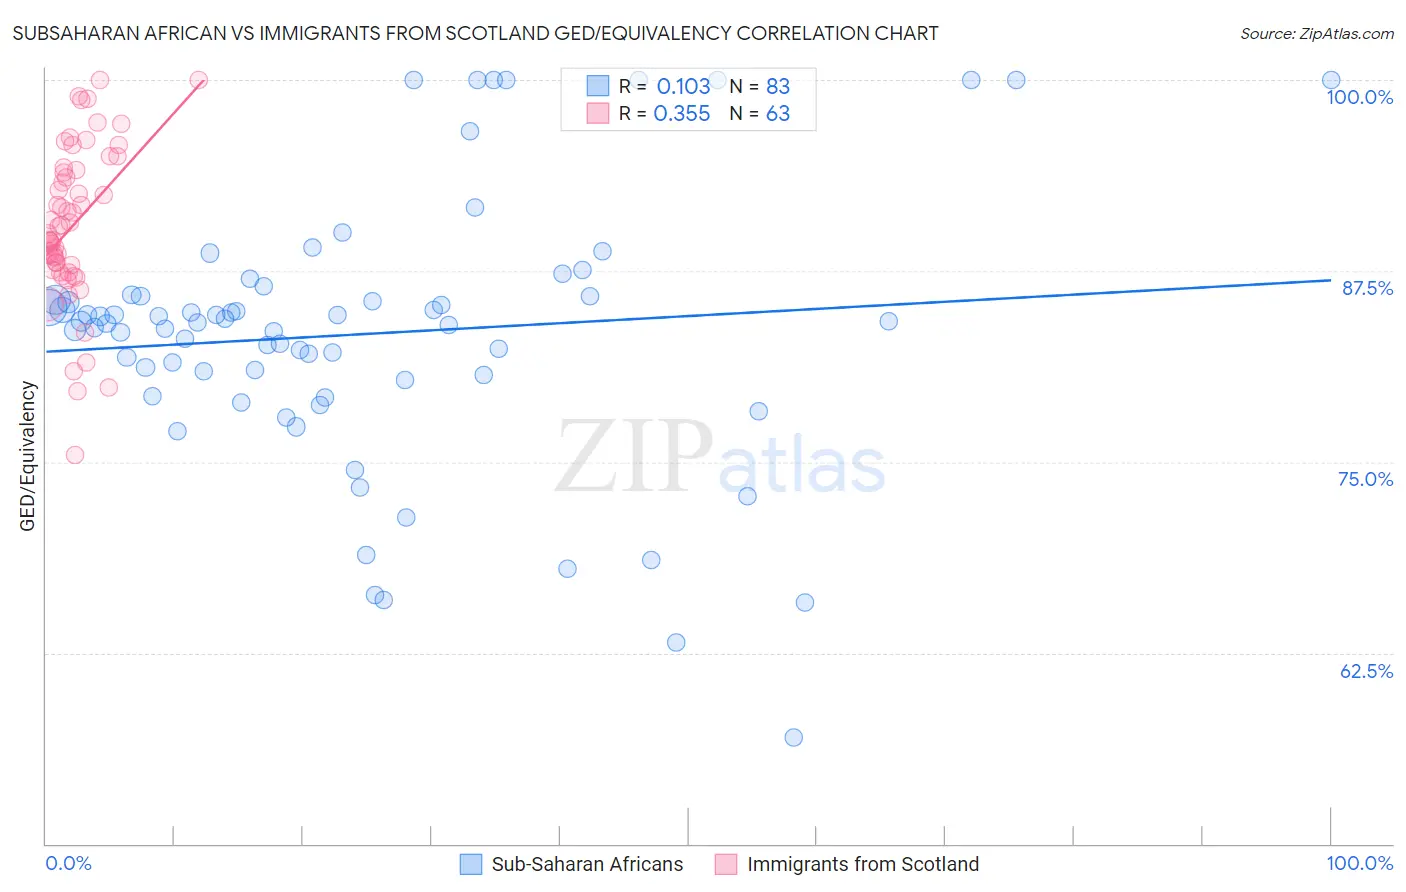
Subsaharan African vs Immigrants from Scotland GED/Equivalency Correlation Chart
The statistical analysis conducted on geographies consisting of 508,215,958 people shows a poor positive correlation between the proportion of Sub-Saharan Africans and percentage of population with at least ged/equivalency education in the United States with a correlation coefficient (R) of 0.103 and weighted average of 84.2%. Similarly, the statistical analysis conducted on geographies consisting of 196,397,786 people shows a mild positive correlation between the proportion of Immigrants from Scotland and percentage of population with at least ged/equivalency education in the United States with a correlation coefficient (R) of 0.355 and weighted average of 88.2%, a difference of 4.7%.
GED/Equivalency Correlation Summary
| Measurement | Subsaharan African | Immigrants from Scotland |
| Minimum | 56.9% | 75.4% |
| Maximum | 100.0% | 100.0% |
| Range | 43.1% | 24.6% |
| Mean | 83.4% | 90.5% |
| Median | 84.2% | 89.9% |
| Interquartile 25% (IQ1) | 80.4% | 87.6% |
| Interquartile 75% (IQ3) | 85.9% | 94.1% |
| Interquartile Range (IQR) | 5.5% | 6.5% |
| Standard Deviation (Sample) | 8.8% | 5.1% |
| Standard Deviation (Population) | 8.7% | 5.1% |
Similar Demographics by GED/Equivalency
Demographics Similar to Sub-Saharan Africans by GED/Equivalency
In terms of ged/equivalency, the demographic groups most similar to Sub-Saharan Africans are Immigrants from Peru (84.2%, a difference of 0.060%), Ghanaian (84.3%, a difference of 0.070%), Immigrants from Eritrea (84.3%, a difference of 0.070%), Immigrants from Bahamas (84.2%, a difference of 0.090%), and Immigrants from Nigeria (84.3%, a difference of 0.10%).
| Demographics | Rating | Rank | GED/Equivalency |
| Immigrants | Colombia | 4.5 /100 | #230 | Tragic 84.4% |
| Immigrants | Middle Africa | 4.3 /100 | #231 | Tragic 84.4% |
| Immigrants | South America | 4.2 /100 | #232 | Tragic 84.4% |
| Immigrants | Panama | 4.1 /100 | #233 | Tragic 84.4% |
| Immigrants | Nigeria | 3.6 /100 | #234 | Tragic 84.3% |
| Ghanaians | 3.5 /100 | #235 | Tragic 84.3% |
| Immigrants | Eritrea | 3.5 /100 | #236 | Tragic 84.3% |
| Sub-Saharan Africans | 3.0 /100 | #237 | Tragic 84.2% |
| Immigrants | Peru | 2.7 /100 | #238 | Tragic 84.2% |
| Immigrants | Bahamas | 2.6 /100 | #239 | Tragic 84.2% |
| Immigrants | South Eastern Asia | 2.5 /100 | #240 | Tragic 84.1% |
| Senegalese | 1.9 /100 | #241 | Tragic 84.0% |
| Sri Lankans | 1.9 /100 | #242 | Tragic 84.0% |
| Cherokee | 1.3 /100 | #243 | Tragic 83.9% |
| Immigrants | Ghana | 1.3 /100 | #244 | Tragic 83.9% |
Demographics Similar to Immigrants from Scotland by GED/Equivalency
In terms of ged/equivalency, the demographic groups most similar to Immigrants from Scotland are Cambodian (88.2%, a difference of 0.0%), Finnish (88.2%, a difference of 0.030%), Macedonian (88.1%, a difference of 0.030%), Italian (88.2%, a difference of 0.050%), and Immigrants from Israel (88.2%, a difference of 0.070%).
| Demographics | Rating | Rank | GED/Equivalency |
| Immigrants | Belgium | 99.7 /100 | #36 | Exceptional 88.3% |
| Immigrants | Austria | 99.7 /100 | #37 | Exceptional 88.3% |
| Burmese | 99.7 /100 | #38 | Exceptional 88.3% |
| Immigrants | Israel | 99.6 /100 | #39 | Exceptional 88.2% |
| Italians | 99.6 /100 | #40 | Exceptional 88.2% |
| Finns | 99.6 /100 | #41 | Exceptional 88.2% |
| Cambodians | 99.6 /100 | #42 | Exceptional 88.2% |
| Immigrants | Scotland | 99.6 /100 | #43 | Exceptional 88.2% |
| Macedonians | 99.5 /100 | #44 | Exceptional 88.1% |
| Czechs | 99.5 /100 | #45 | Exceptional 88.1% |
| Immigrants | Switzerland | 99.5 /100 | #46 | Exceptional 88.1% |
| Immigrants | Latvia | 99.5 /100 | #47 | Exceptional 88.1% |
| Greeks | 99.5 /100 | #48 | Exceptional 88.1% |
| Australians | 99.5 /100 | #49 | Exceptional 88.1% |
| Immigrants | Korea | 99.5 /100 | #50 | Exceptional 88.1% |