Subsaharan African vs Tohono O'odham GED/Equivalency
COMPARE
Subsaharan African
Tohono O'odham
GED/Equivalency
GED/Equivalency Comparison
Sub-Saharan Africans
Tohono O'odham
84.2%
GED/EQUIVALENCY
3.0/ 100
METRIC RATING
237th/ 347
METRIC RANK
77.5%
GED/EQUIVALENCY
0.0/ 100
METRIC RATING
340th/ 347
METRIC RANK
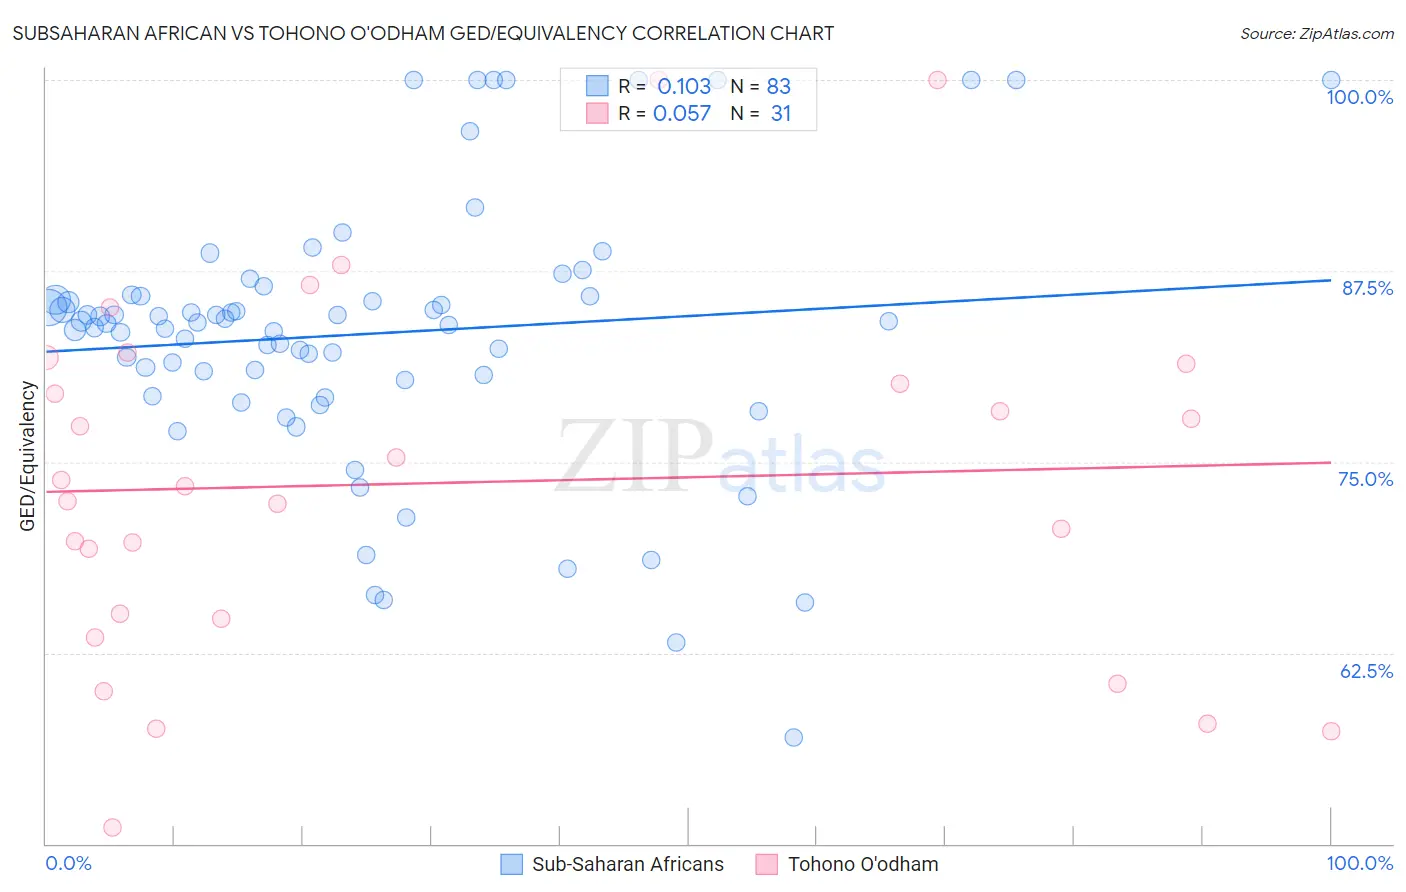
Subsaharan African vs Tohono O'odham GED/Equivalency Correlation Chart
The statistical analysis conducted on geographies consisting of 508,215,958 people shows a poor positive correlation between the proportion of Sub-Saharan Africans and percentage of population with at least ged/equivalency education in the United States with a correlation coefficient (R) of 0.103 and weighted average of 84.2%. Similarly, the statistical analysis conducted on geographies consisting of 58,730,525 people shows a slight positive correlation between the proportion of Tohono O'odham and percentage of population with at least ged/equivalency education in the United States with a correlation coefficient (R) of 0.057 and weighted average of 77.5%, a difference of 8.7%.
GED/Equivalency Correlation Summary
| Measurement | Subsaharan African | Tohono O'odham |
| Minimum | 56.9% | 51.1% |
| Maximum | 100.0% | 100.0% |
| Range | 43.1% | 48.9% |
| Mean | 83.4% | 73.6% |
| Median | 84.2% | 73.4% |
| Interquartile 25% (IQ1) | 80.4% | 64.7% |
| Interquartile 75% (IQ3) | 85.9% | 81.4% |
| Interquartile Range (IQR) | 5.5% | 16.7% |
| Standard Deviation (Sample) | 8.8% | 11.8% |
| Standard Deviation (Population) | 8.7% | 11.6% |
Similar Demographics by GED/Equivalency
Demographics Similar to Sub-Saharan Africans by GED/Equivalency
In terms of ged/equivalency, the demographic groups most similar to Sub-Saharan Africans are Immigrants from Peru (84.2%, a difference of 0.060%), Ghanaian (84.3%, a difference of 0.070%), Immigrants from Eritrea (84.3%, a difference of 0.070%), Immigrants from Bahamas (84.2%, a difference of 0.090%), and Immigrants from Nigeria (84.3%, a difference of 0.10%).
| Demographics | Rating | Rank | GED/Equivalency |
| Immigrants | Colombia | 4.5 /100 | #230 | Tragic 84.4% |
| Immigrants | Middle Africa | 4.3 /100 | #231 | Tragic 84.4% |
| Immigrants | South America | 4.2 /100 | #232 | Tragic 84.4% |
| Immigrants | Panama | 4.1 /100 | #233 | Tragic 84.4% |
| Immigrants | Nigeria | 3.6 /100 | #234 | Tragic 84.3% |
| Ghanaians | 3.5 /100 | #235 | Tragic 84.3% |
| Immigrants | Eritrea | 3.5 /100 | #236 | Tragic 84.3% |
| Sub-Saharan Africans | 3.0 /100 | #237 | Tragic 84.2% |
| Immigrants | Peru | 2.7 /100 | #238 | Tragic 84.2% |
| Immigrants | Bahamas | 2.6 /100 | #239 | Tragic 84.2% |
| Immigrants | South Eastern Asia | 2.5 /100 | #240 | Tragic 84.1% |
| Senegalese | 1.9 /100 | #241 | Tragic 84.0% |
| Sri Lankans | 1.9 /100 | #242 | Tragic 84.0% |
| Cherokee | 1.3 /100 | #243 | Tragic 83.9% |
| Immigrants | Ghana | 1.3 /100 | #244 | Tragic 83.9% |
Demographics Similar to Tohono O'odham by GED/Equivalency
In terms of ged/equivalency, the demographic groups most similar to Tohono O'odham are Mexican (77.4%, a difference of 0.090%), Immigrants from El Salvador (77.6%, a difference of 0.16%), Immigrants from Guatemala (77.9%, a difference of 0.54%), Immigrants from Yemen (77.9%, a difference of 0.56%), and Immigrants from Dominican Republic (78.0%, a difference of 0.63%).
| Demographics | Rating | Rank | GED/Equivalency |
| Salvadorans | 0.0 /100 | #333 | Tragic 78.6% |
| Guatemalans | 0.0 /100 | #334 | Tragic 78.5% |
| Immigrants | Latin America | 0.0 /100 | #335 | Tragic 78.5% |
| Immigrants | Dominican Republic | 0.0 /100 | #336 | Tragic 78.0% |
| Immigrants | Yemen | 0.0 /100 | #337 | Tragic 77.9% |
| Immigrants | Guatemala | 0.0 /100 | #338 | Tragic 77.9% |
| Immigrants | El Salvador | 0.0 /100 | #339 | Tragic 77.6% |
| Tohono O'odham | 0.0 /100 | #340 | Tragic 77.5% |
| Mexicans | 0.0 /100 | #341 | Tragic 77.4% |
| Pima | 0.0 /100 | #342 | Tragic 76.4% |
| Immigrants | Central America | 0.0 /100 | #343 | Tragic 76.4% |
| Spanish American Indians | 0.0 /100 | #344 | Tragic 76.3% |
| Immigrants | Mexico | 0.0 /100 | #345 | Tragic 75.7% |
| Houma | 0.0 /100 | #346 | Tragic 75.0% |
| Yakama | 0.0 /100 | #347 | Tragic 74.5% |