Norwegian vs Immigrants from Scotland GED/Equivalency
COMPARE
Norwegian
Immigrants from Scotland
GED/Equivalency
GED/Equivalency Comparison
Norwegians
Immigrants from Scotland
89.0%
GED/EQUIVALENCY
99.9/ 100
METRIC RATING
10th/ 347
METRIC RANK
88.2%
GED/EQUIVALENCY
99.6/ 100
METRIC RATING
43rd/ 347
METRIC RANK
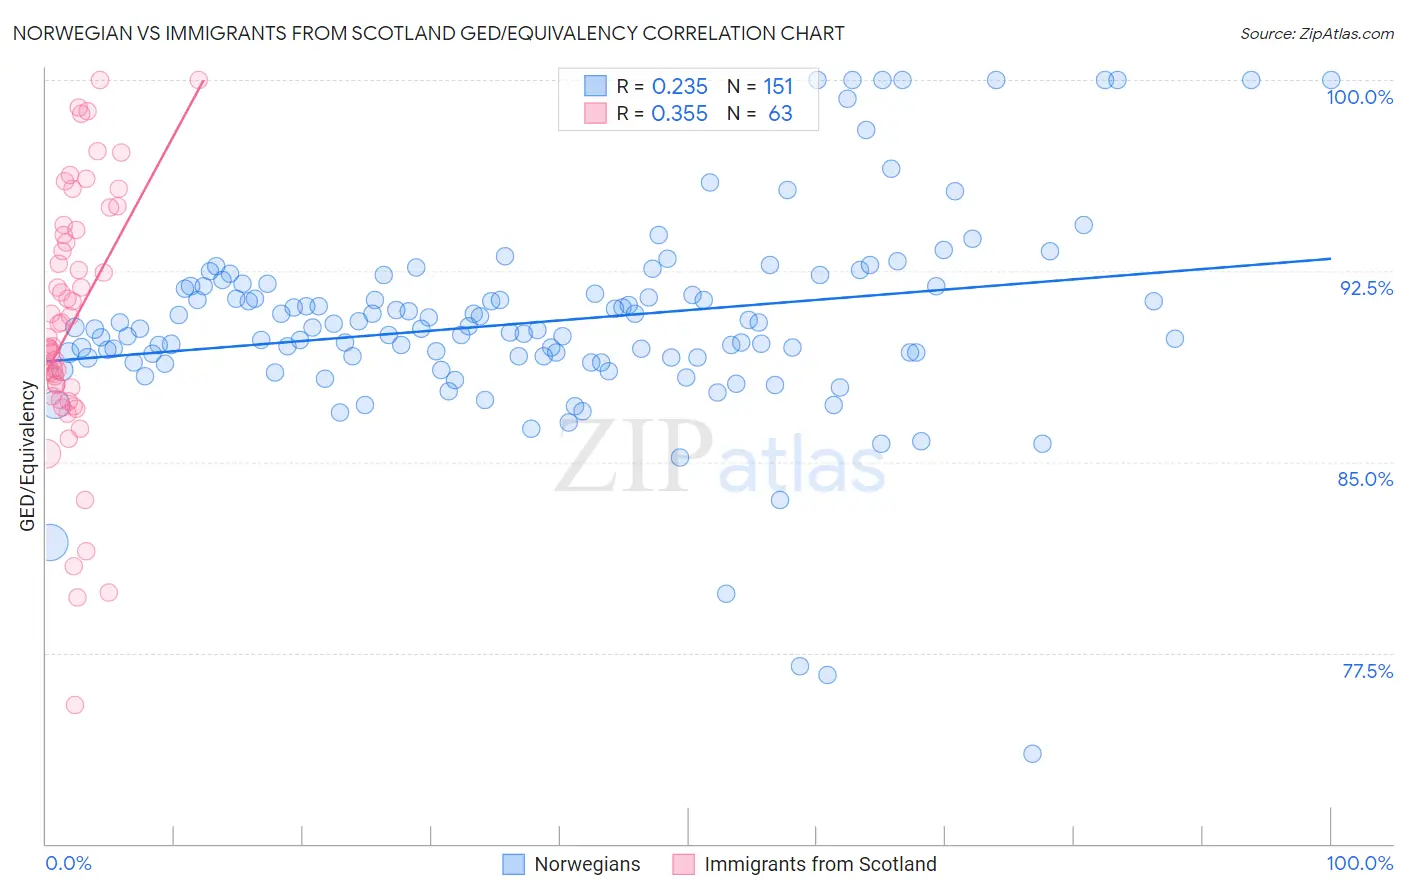
Norwegian vs Immigrants from Scotland GED/Equivalency Correlation Chart
The statistical analysis conducted on geographies consisting of 533,395,248 people shows a weak positive correlation between the proportion of Norwegians and percentage of population with at least ged/equivalency education in the United States with a correlation coefficient (R) of 0.235 and weighted average of 89.0%. Similarly, the statistical analysis conducted on geographies consisting of 196,397,786 people shows a mild positive correlation between the proportion of Immigrants from Scotland and percentage of population with at least ged/equivalency education in the United States with a correlation coefficient (R) of 0.355 and weighted average of 88.2%, a difference of 0.95%.
GED/Equivalency Correlation Summary
| Measurement | Norwegian | Immigrants from Scotland |
| Minimum | 73.5% | 75.4% |
| Maximum | 100.0% | 100.0% |
| Range | 26.5% | 24.6% |
| Mean | 90.5% | 90.5% |
| Median | 90.2% | 89.9% |
| Interquartile 25% (IQ1) | 89.1% | 87.6% |
| Interquartile 75% (IQ3) | 91.9% | 94.1% |
| Interquartile Range (IQR) | 2.8% | 6.5% |
| Standard Deviation (Sample) | 4.0% | 5.1% |
| Standard Deviation (Population) | 4.0% | 5.1% |
Similar Demographics by GED/Equivalency
Demographics Similar to Norwegians by GED/Equivalency
In terms of ged/equivalency, the demographic groups most similar to Norwegians are Chinese (89.0%, a difference of 0.040%), Bulgarian (89.0%, a difference of 0.040%), Carpatho Rusyn (89.1%, a difference of 0.070%), Lithuanian (88.9%, a difference of 0.080%), and Immigrants from Iran (88.9%, a difference of 0.080%).
| Demographics | Rating | Rank | GED/Equivalency |
| Immigrants | Singapore | 100.0 /100 | #3 | Exceptional 89.3% |
| Iranians | 100.0 /100 | #4 | Exceptional 89.2% |
| Latvians | 100.0 /100 | #5 | Exceptional 89.2% |
| Thais | 100.0 /100 | #6 | Exceptional 89.1% |
| Eastern Europeans | 99.9 /100 | #7 | Exceptional 89.1% |
| Carpatho Rusyns | 99.9 /100 | #8 | Exceptional 89.1% |
| Chinese | 99.9 /100 | #9 | Exceptional 89.0% |
| Norwegians | 99.9 /100 | #10 | Exceptional 89.0% |
| Bulgarians | 99.9 /100 | #11 | Exceptional 89.0% |
| Lithuanians | 99.9 /100 | #12 | Exceptional 88.9% |
| Immigrants | Iran | 99.9 /100 | #13 | Exceptional 88.9% |
| Cypriots | 99.9 /100 | #14 | Exceptional 88.9% |
| Okinawans | 99.9 /100 | #15 | Exceptional 88.9% |
| Immigrants | Taiwan | 99.9 /100 | #16 | Exceptional 88.8% |
| Croatians | 99.9 /100 | #17 | Exceptional 88.8% |
Demographics Similar to Immigrants from Scotland by GED/Equivalency
In terms of ged/equivalency, the demographic groups most similar to Immigrants from Scotland are Cambodian (88.2%, a difference of 0.0%), Finnish (88.2%, a difference of 0.030%), Macedonian (88.1%, a difference of 0.030%), Italian (88.2%, a difference of 0.050%), and Immigrants from Israel (88.2%, a difference of 0.070%).
| Demographics | Rating | Rank | GED/Equivalency |
| Immigrants | Belgium | 99.7 /100 | #36 | Exceptional 88.3% |
| Immigrants | Austria | 99.7 /100 | #37 | Exceptional 88.3% |
| Burmese | 99.7 /100 | #38 | Exceptional 88.3% |
| Immigrants | Israel | 99.6 /100 | #39 | Exceptional 88.2% |
| Italians | 99.6 /100 | #40 | Exceptional 88.2% |
| Finns | 99.6 /100 | #41 | Exceptional 88.2% |
| Cambodians | 99.6 /100 | #42 | Exceptional 88.2% |
| Immigrants | Scotland | 99.6 /100 | #43 | Exceptional 88.2% |
| Macedonians | 99.5 /100 | #44 | Exceptional 88.1% |
| Czechs | 99.5 /100 | #45 | Exceptional 88.1% |
| Immigrants | Switzerland | 99.5 /100 | #46 | Exceptional 88.1% |
| Immigrants | Latvia | 99.5 /100 | #47 | Exceptional 88.1% |
| Greeks | 99.5 /100 | #48 | Exceptional 88.1% |
| Australians | 99.5 /100 | #49 | Exceptional 88.1% |
| Immigrants | Korea | 99.5 /100 | #50 | Exceptional 88.1% |