Slovak vs Immigrants from Scotland GED/Equivalency
COMPARE
Slovak
Immigrants from Scotland
GED/Equivalency
GED/Equivalency Comparison
Slovaks
Immigrants from Scotland
88.6%
GED/EQUIVALENCY
99.8/ 100
METRIC RATING
24th/ 347
METRIC RANK
88.2%
GED/EQUIVALENCY
99.6/ 100
METRIC RATING
43rd/ 347
METRIC RANK
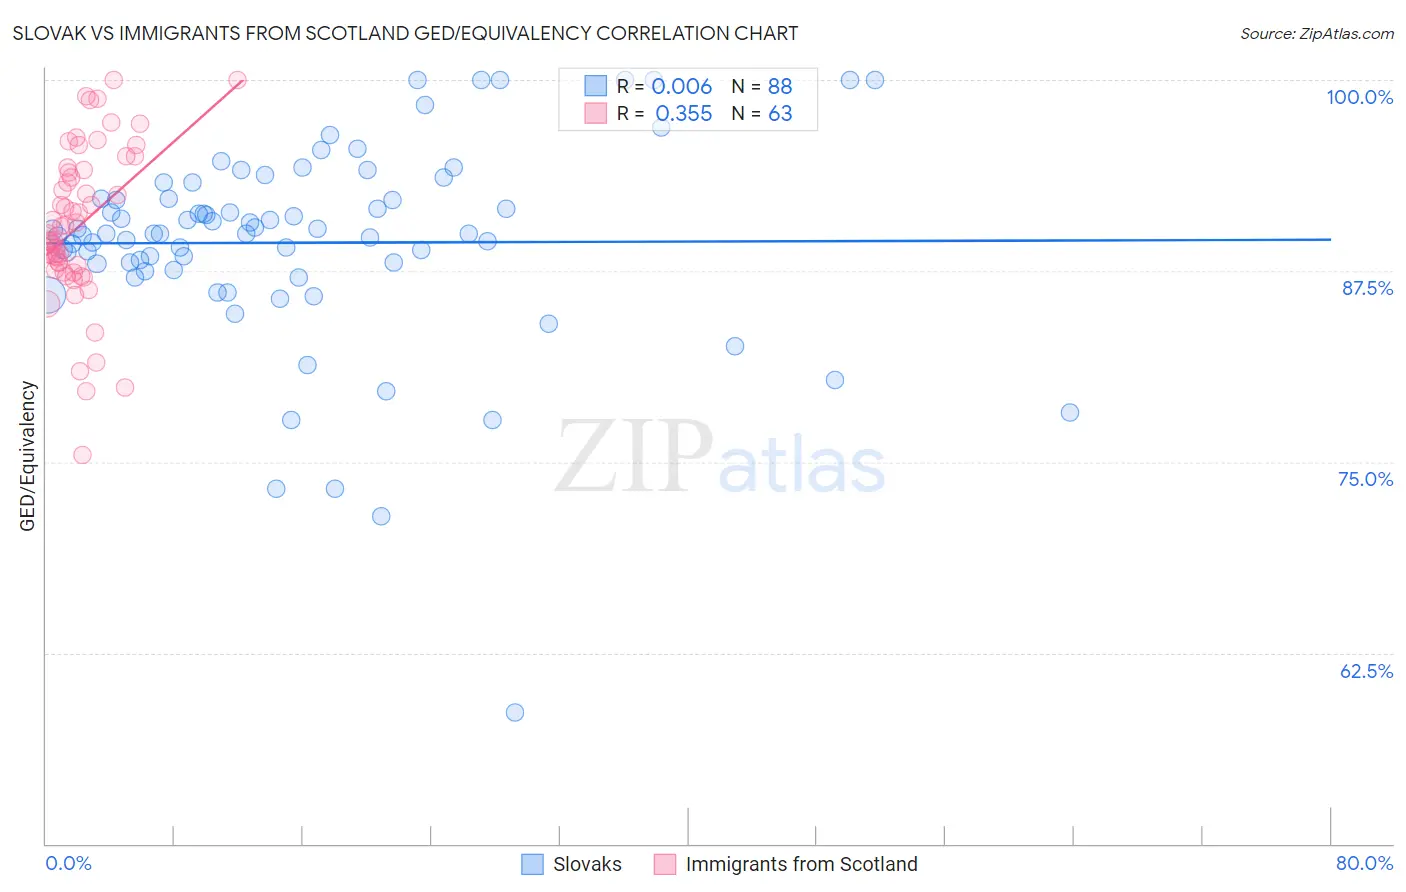
Slovak vs Immigrants from Scotland GED/Equivalency Correlation Chart
The statistical analysis conducted on geographies consisting of 397,891,790 people shows no correlation between the proportion of Slovaks and percentage of population with at least ged/equivalency education in the United States with a correlation coefficient (R) of 0.006 and weighted average of 88.6%. Similarly, the statistical analysis conducted on geographies consisting of 196,397,786 people shows a mild positive correlation between the proportion of Immigrants from Scotland and percentage of population with at least ged/equivalency education in the United States with a correlation coefficient (R) of 0.355 and weighted average of 88.2%, a difference of 0.49%.
GED/Equivalency Correlation Summary
| Measurement | Slovak | Immigrants from Scotland |
| Minimum | 58.6% | 75.4% |
| Maximum | 100.0% | 100.0% |
| Range | 41.4% | 24.6% |
| Mean | 89.4% | 90.5% |
| Median | 89.9% | 89.9% |
| Interquartile 25% (IQ1) | 87.8% | 87.6% |
| Interquartile 75% (IQ3) | 92.2% | 94.1% |
| Interquartile Range (IQR) | 4.4% | 6.5% |
| Standard Deviation (Sample) | 6.7% | 5.1% |
| Standard Deviation (Population) | 6.7% | 5.1% |
Demographics Similar to Slovaks and Immigrants from Scotland by GED/Equivalency
In terms of ged/equivalency, the demographic groups most similar to Slovaks are Russian (88.6%, a difference of 0.0%), Estonian (88.6%, a difference of 0.0%), Immigrants from Australia (88.6%, a difference of 0.0%), Immigrants from Lithuania (88.6%, a difference of 0.040%), and Immigrants from Northern Europe (88.5%, a difference of 0.080%). Similarly, the demographic groups most similar to Immigrants from Scotland are Cambodian (88.2%, a difference of 0.0%), Finnish (88.2%, a difference of 0.030%), Italian (88.2%, a difference of 0.050%), Immigrants from Israel (88.2%, a difference of 0.070%), and Burmese (88.3%, a difference of 0.16%).
| Demographics | Rating | Rank | GED/Equivalency |
| Russians | 99.8 /100 | #23 | Exceptional 88.6% |
| Slovaks | 99.8 /100 | #24 | Exceptional 88.6% |
| Estonians | 99.8 /100 | #25 | Exceptional 88.6% |
| Immigrants | Australia | 99.8 /100 | #26 | Exceptional 88.6% |
| Immigrants | Lithuania | 99.8 /100 | #27 | Exceptional 88.6% |
| Immigrants | Northern Europe | 99.8 /100 | #28 | Exceptional 88.5% |
| Poles | 99.8 /100 | #29 | Exceptional 88.5% |
| Turks | 99.8 /100 | #30 | Exceptional 88.5% |
| Bhutanese | 99.8 /100 | #31 | Exceptional 88.4% |
| Danes | 99.8 /100 | #32 | Exceptional 88.4% |
| Immigrants | Sweden | 99.7 /100 | #33 | Exceptional 88.4% |
| Immigrants | Japan | 99.7 /100 | #34 | Exceptional 88.4% |
| Immigrants | South Central Asia | 99.7 /100 | #35 | Exceptional 88.4% |
| Immigrants | Belgium | 99.7 /100 | #36 | Exceptional 88.3% |
| Immigrants | Austria | 99.7 /100 | #37 | Exceptional 88.3% |
| Burmese | 99.7 /100 | #38 | Exceptional 88.3% |
| Immigrants | Israel | 99.6 /100 | #39 | Exceptional 88.2% |
| Italians | 99.6 /100 | #40 | Exceptional 88.2% |
| Finns | 99.6 /100 | #41 | Exceptional 88.2% |
| Cambodians | 99.6 /100 | #42 | Exceptional 88.2% |
| Immigrants | Scotland | 99.6 /100 | #43 | Exceptional 88.2% |