Somali vs Immigrants from Scotland GED/Equivalency
COMPARE
Somali
Immigrants from Scotland
GED/Equivalency
GED/Equivalency Comparison
Somalis
Immigrants from Scotland
85.0%
GED/EQUIVALENCY
16.4/ 100
METRIC RATING
199th/ 347
METRIC RANK
88.2%
GED/EQUIVALENCY
99.6/ 100
METRIC RATING
43rd/ 347
METRIC RANK
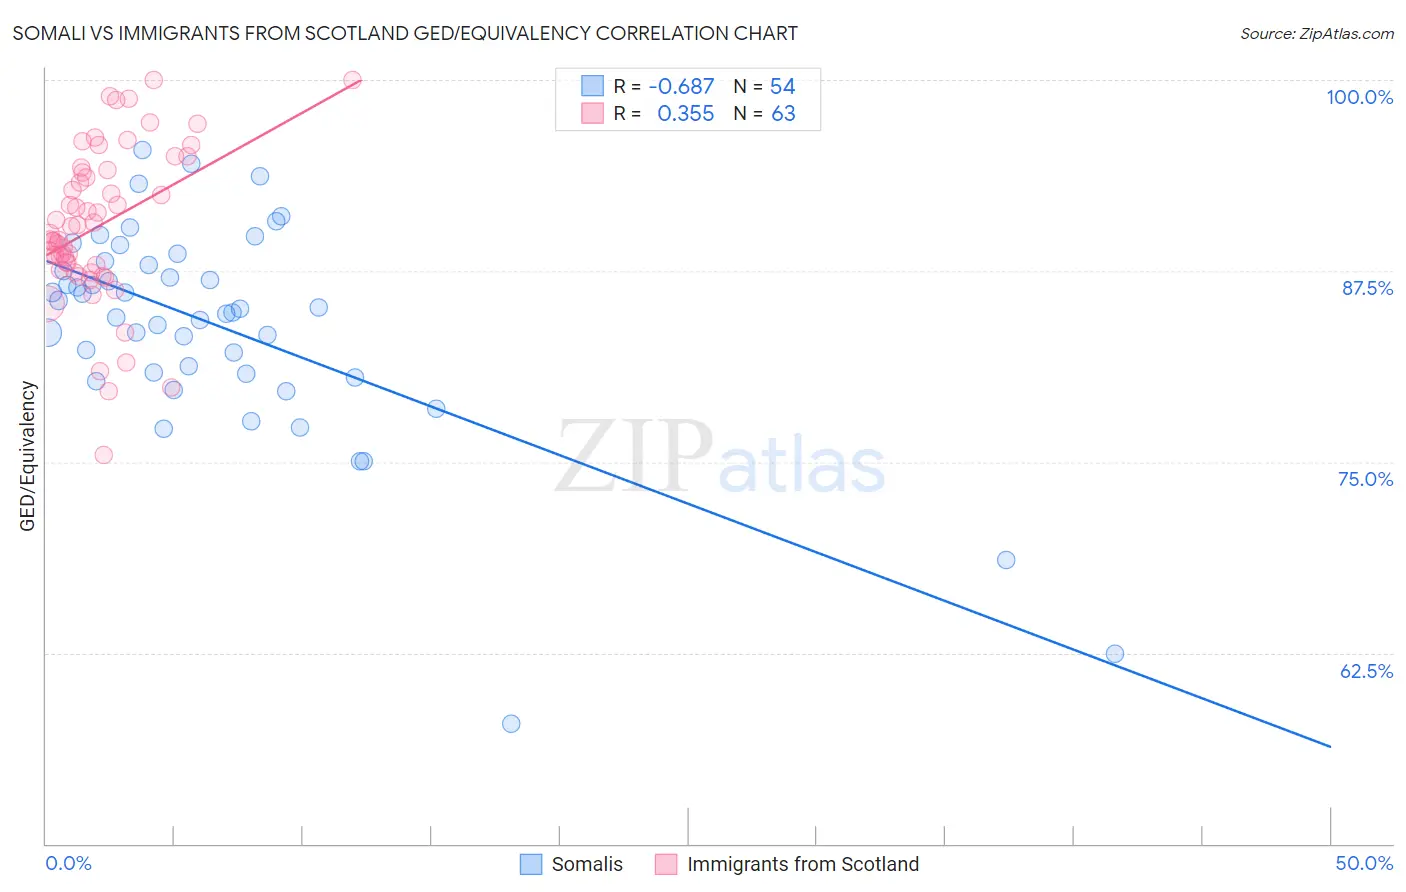
Somali vs Immigrants from Scotland GED/Equivalency Correlation Chart
The statistical analysis conducted on geographies consisting of 99,332,457 people shows a significant negative correlation between the proportion of Somalis and percentage of population with at least ged/equivalency education in the United States with a correlation coefficient (R) of -0.687 and weighted average of 85.0%. Similarly, the statistical analysis conducted on geographies consisting of 196,397,786 people shows a mild positive correlation between the proportion of Immigrants from Scotland and percentage of population with at least ged/equivalency education in the United States with a correlation coefficient (R) of 0.355 and weighted average of 88.2%, a difference of 3.7%.
GED/Equivalency Correlation Summary
| Measurement | Somali | Immigrants from Scotland |
| Minimum | 57.9% | 75.4% |
| Maximum | 95.4% | 100.0% |
| Range | 37.5% | 24.6% |
| Mean | 83.8% | 90.5% |
| Median | 84.9% | 89.9% |
| Interquartile 25% (IQ1) | 80.8% | 87.6% |
| Interquartile 75% (IQ3) | 87.9% | 94.1% |
| Interquartile Range (IQR) | 7.1% | 6.5% |
| Standard Deviation (Sample) | 7.0% | 5.1% |
| Standard Deviation (Population) | 7.0% | 5.1% |
Similar Demographics by GED/Equivalency
Demographics Similar to Somalis by GED/Equivalency
In terms of ged/equivalency, the demographic groups most similar to Somalis are Uruguayan (85.0%, a difference of 0.010%), Portuguese (85.0%, a difference of 0.020%), Cree (85.0%, a difference of 0.020%), Immigrants from Africa (85.1%, a difference of 0.040%), and Panamanian (85.0%, a difference of 0.040%).
| Demographics | Rating | Rank | GED/Equivalency |
| Immigrants | Nonimmigrants | 22.7 /100 | #192 | Fair 85.2% |
| Delaware | 22.2 /100 | #193 | Fair 85.2% |
| Puget Sound Salish | 20.8 /100 | #194 | Fair 85.2% |
| Chippewa | 20.8 /100 | #195 | Fair 85.2% |
| Tongans | 20.7 /100 | #196 | Fair 85.2% |
| Costa Ricans | 20.4 /100 | #197 | Fair 85.2% |
| Immigrants | Africa | 17.5 /100 | #198 | Poor 85.1% |
| Somalis | 16.4 /100 | #199 | Poor 85.0% |
| Uruguayans | 16.0 /100 | #200 | Poor 85.0% |
| Portuguese | 15.9 /100 | #201 | Poor 85.0% |
| Cree | 15.9 /100 | #202 | Poor 85.0% |
| Panamanians | 15.3 /100 | #203 | Poor 85.0% |
| Hawaiians | 15.2 /100 | #204 | Poor 85.0% |
| Liberians | 14.6 /100 | #205 | Poor 85.0% |
| Samoans | 13.7 /100 | #206 | Poor 84.9% |
Demographics Similar to Immigrants from Scotland by GED/Equivalency
In terms of ged/equivalency, the demographic groups most similar to Immigrants from Scotland are Cambodian (88.2%, a difference of 0.0%), Finnish (88.2%, a difference of 0.030%), Macedonian (88.1%, a difference of 0.030%), Italian (88.2%, a difference of 0.050%), and Immigrants from Israel (88.2%, a difference of 0.070%).
| Demographics | Rating | Rank | GED/Equivalency |
| Immigrants | Belgium | 99.7 /100 | #36 | Exceptional 88.3% |
| Immigrants | Austria | 99.7 /100 | #37 | Exceptional 88.3% |
| Burmese | 99.7 /100 | #38 | Exceptional 88.3% |
| Immigrants | Israel | 99.6 /100 | #39 | Exceptional 88.2% |
| Italians | 99.6 /100 | #40 | Exceptional 88.2% |
| Finns | 99.6 /100 | #41 | Exceptional 88.2% |
| Cambodians | 99.6 /100 | #42 | Exceptional 88.2% |
| Immigrants | Scotland | 99.6 /100 | #43 | Exceptional 88.2% |
| Macedonians | 99.5 /100 | #44 | Exceptional 88.1% |
| Czechs | 99.5 /100 | #45 | Exceptional 88.1% |
| Immigrants | Switzerland | 99.5 /100 | #46 | Exceptional 88.1% |
| Immigrants | Latvia | 99.5 /100 | #47 | Exceptional 88.1% |
| Greeks | 99.5 /100 | #48 | Exceptional 88.1% |
| Australians | 99.5 /100 | #49 | Exceptional 88.1% |
| Immigrants | Korea | 99.5 /100 | #50 | Exceptional 88.1% |