Subsaharan African vs Korean GED/Equivalency
COMPARE
Subsaharan African
Korean
GED/Equivalency
GED/Equivalency Comparison
Sub-Saharan Africans
Koreans
84.2%
GED/EQUIVALENCY
3.0/ 100
METRIC RATING
237th/ 347
METRIC RANK
85.6%
GED/EQUIVALENCY
41.2/ 100
METRIC RATING
178th/ 347
METRIC RANK
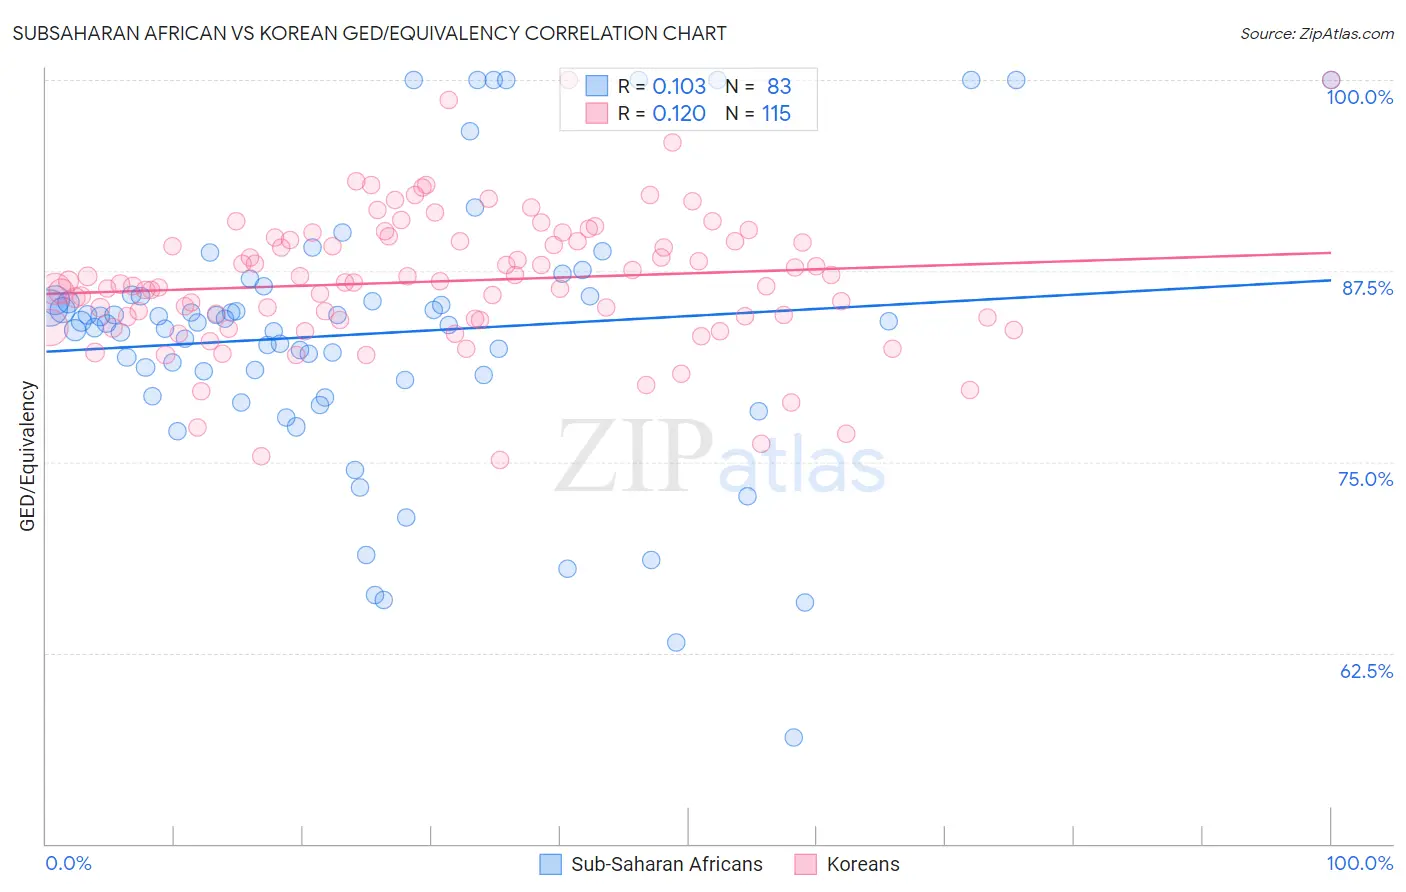
Subsaharan African vs Korean GED/Equivalency Correlation Chart
The statistical analysis conducted on geographies consisting of 508,215,958 people shows a poor positive correlation between the proportion of Sub-Saharan Africans and percentage of population with at least ged/equivalency education in the United States with a correlation coefficient (R) of 0.103 and weighted average of 84.2%. Similarly, the statistical analysis conducted on geographies consisting of 510,944,156 people shows a poor positive correlation between the proportion of Koreans and percentage of population with at least ged/equivalency education in the United States with a correlation coefficient (R) of 0.120 and weighted average of 85.6%, a difference of 1.6%.
GED/Equivalency Correlation Summary
| Measurement | Subsaharan African | Korean |
| Minimum | 56.9% | 75.1% |
| Maximum | 100.0% | 100.0% |
| Range | 43.1% | 24.9% |
| Mean | 83.4% | 86.8% |
| Median | 84.2% | 86.8% |
| Interquartile 25% (IQ1) | 80.4% | 84.3% |
| Interquartile 75% (IQ3) | 85.9% | 89.5% |
| Interquartile Range (IQR) | 5.5% | 5.2% |
| Standard Deviation (Sample) | 8.8% | 4.5% |
| Standard Deviation (Population) | 8.7% | 4.5% |
Similar Demographics by GED/Equivalency
Demographics Similar to Sub-Saharan Africans by GED/Equivalency
In terms of ged/equivalency, the demographic groups most similar to Sub-Saharan Africans are Immigrants from Peru (84.2%, a difference of 0.060%), Ghanaian (84.3%, a difference of 0.070%), Immigrants from Eritrea (84.3%, a difference of 0.070%), Immigrants from Bahamas (84.2%, a difference of 0.090%), and Immigrants from Nigeria (84.3%, a difference of 0.10%).
| Demographics | Rating | Rank | GED/Equivalency |
| Immigrants | Colombia | 4.5 /100 | #230 | Tragic 84.4% |
| Immigrants | Middle Africa | 4.3 /100 | #231 | Tragic 84.4% |
| Immigrants | South America | 4.2 /100 | #232 | Tragic 84.4% |
| Immigrants | Panama | 4.1 /100 | #233 | Tragic 84.4% |
| Immigrants | Nigeria | 3.6 /100 | #234 | Tragic 84.3% |
| Ghanaians | 3.5 /100 | #235 | Tragic 84.3% |
| Immigrants | Eritrea | 3.5 /100 | #236 | Tragic 84.3% |
| Sub-Saharan Africans | 3.0 /100 | #237 | Tragic 84.2% |
| Immigrants | Peru | 2.7 /100 | #238 | Tragic 84.2% |
| Immigrants | Bahamas | 2.6 /100 | #239 | Tragic 84.2% |
| Immigrants | South Eastern Asia | 2.5 /100 | #240 | Tragic 84.1% |
| Senegalese | 1.9 /100 | #241 | Tragic 84.0% |
| Sri Lankans | 1.9 /100 | #242 | Tragic 84.0% |
| Cherokee | 1.3 /100 | #243 | Tragic 83.9% |
| Immigrants | Ghana | 1.3 /100 | #244 | Tragic 83.9% |
Demographics Similar to Koreans by GED/Equivalency
In terms of ged/equivalency, the demographic groups most similar to Koreans are Aleut (85.6%, a difference of 0.020%), Immigrants from Southern Europe (85.5%, a difference of 0.060%), Immigrants from Uganda (85.7%, a difference of 0.080%), Moroccan (85.5%, a difference of 0.080%), and Immigrants from Eastern Africa (85.7%, a difference of 0.13%).
| Demographics | Rating | Rank | GED/Equivalency |
| Immigrants | Chile | 57.3 /100 | #171 | Average 85.9% |
| Bermudans | 55.1 /100 | #172 | Average 85.8% |
| Immigrants | Venezuela | 50.7 /100 | #173 | Average 85.8% |
| Ottawa | 50.0 /100 | #174 | Average 85.8% |
| Immigrants | Bolivia | 49.8 /100 | #175 | Average 85.8% |
| Immigrants | Eastern Africa | 47.7 /100 | #176 | Average 85.7% |
| Immigrants | Uganda | 45.2 /100 | #177 | Average 85.7% |
| Koreans | 41.2 /100 | #178 | Average 85.6% |
| Aleuts | 40.5 /100 | #179 | Average 85.6% |
| Immigrants | Southern Europe | 38.4 /100 | #180 | Fair 85.5% |
| Moroccans | 37.7 /100 | #181 | Fair 85.5% |
| Sudanese | 35.2 /100 | #182 | Fair 85.5% |
| Immigrants | Sudan | 34.2 /100 | #183 | Fair 85.5% |
| Immigrants | Oceania | 33.6 /100 | #184 | Fair 85.5% |
| Spanish | 32.8 /100 | #185 | Fair 85.4% |