Sri Lankan vs Immigrants from Scotland GED/Equivalency
COMPARE
Sri Lankan
Immigrants from Scotland
GED/Equivalency
GED/Equivalency Comparison
Sri Lankans
Immigrants from Scotland
84.0%
GED/EQUIVALENCY
1.9/ 100
METRIC RATING
242nd/ 347
METRIC RANK
88.2%
GED/EQUIVALENCY
99.6/ 100
METRIC RATING
43rd/ 347
METRIC RANK
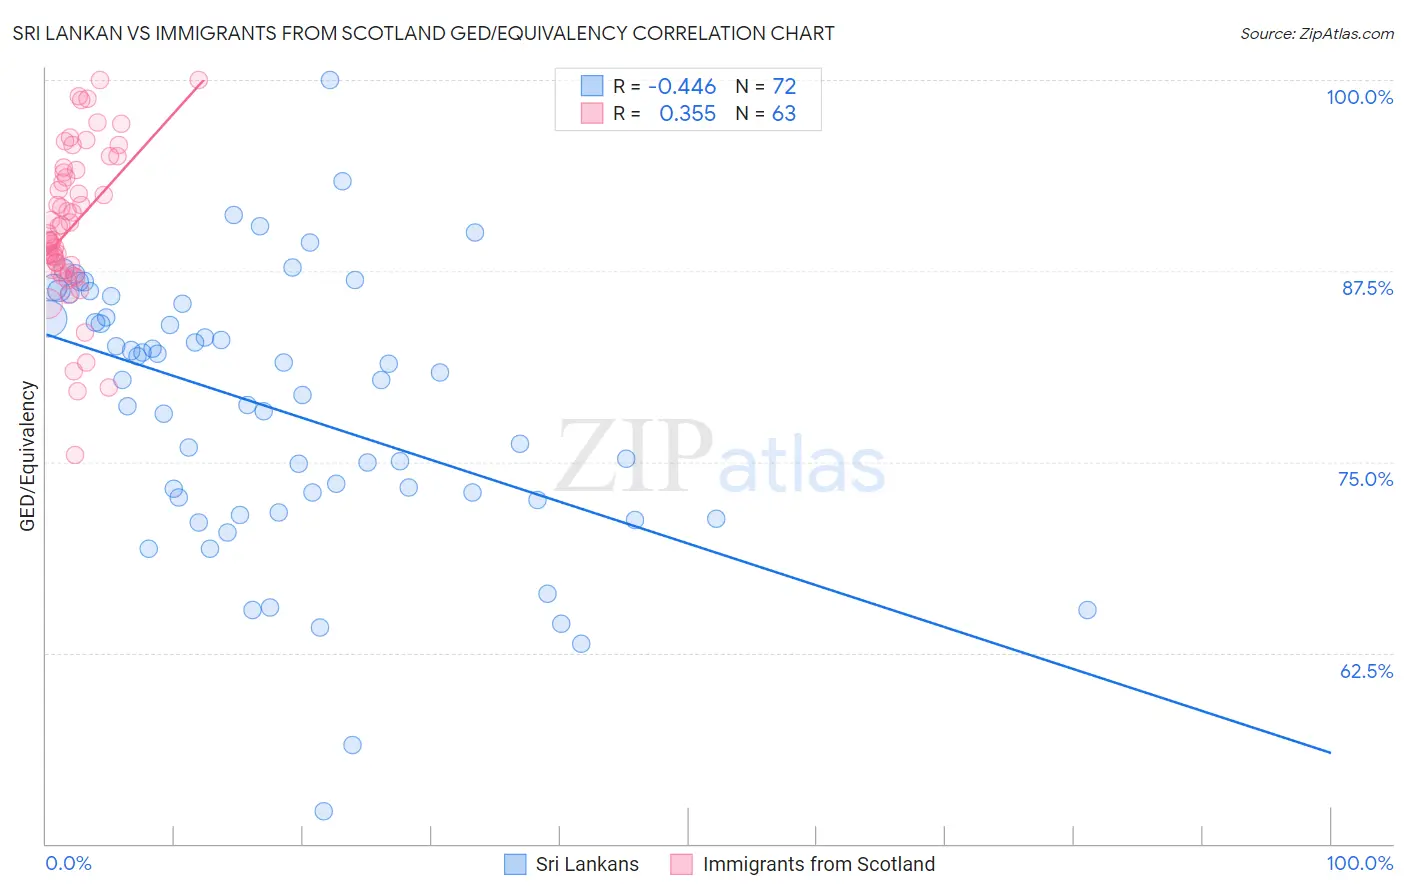
Sri Lankan vs Immigrants from Scotland GED/Equivalency Correlation Chart
The statistical analysis conducted on geographies consisting of 440,593,488 people shows a moderate negative correlation between the proportion of Sri Lankans and percentage of population with at least ged/equivalency education in the United States with a correlation coefficient (R) of -0.446 and weighted average of 84.0%. Similarly, the statistical analysis conducted on geographies consisting of 196,397,786 people shows a mild positive correlation between the proportion of Immigrants from Scotland and percentage of population with at least ged/equivalency education in the United States with a correlation coefficient (R) of 0.355 and weighted average of 88.2%, a difference of 4.9%.
GED/Equivalency Correlation Summary
| Measurement | Sri Lankan | Immigrants from Scotland |
| Minimum | 52.1% | 75.4% |
| Maximum | 100.0% | 100.0% |
| Range | 47.9% | 24.6% |
| Mean | 78.4% | 90.5% |
| Median | 80.3% | 89.9% |
| Interquartile 25% (IQ1) | 72.6% | 87.6% |
| Interquartile 75% (IQ3) | 84.9% | 94.1% |
| Interquartile Range (IQR) | 12.3% | 6.5% |
| Standard Deviation (Sample) | 8.9% | 5.1% |
| Standard Deviation (Population) | 8.8% | 5.1% |
Similar Demographics by GED/Equivalency
Demographics Similar to Sri Lankans by GED/Equivalency
In terms of ged/equivalency, the demographic groups most similar to Sri Lankans are Senegalese (84.0%, a difference of 0.020%), Immigrants from South Eastern Asia (84.1%, a difference of 0.16%), Cherokee (83.9%, a difference of 0.17%), Immigrants from Bahamas (84.2%, a difference of 0.18%), and Immigrants from Ghana (83.9%, a difference of 0.18%).
| Demographics | Rating | Rank | GED/Equivalency |
| Ghanaians | 3.5 /100 | #235 | Tragic 84.3% |
| Immigrants | Eritrea | 3.5 /100 | #236 | Tragic 84.3% |
| Sub-Saharan Africans | 3.0 /100 | #237 | Tragic 84.2% |
| Immigrants | Peru | 2.7 /100 | #238 | Tragic 84.2% |
| Immigrants | Bahamas | 2.6 /100 | #239 | Tragic 84.2% |
| Immigrants | South Eastern Asia | 2.5 /100 | #240 | Tragic 84.1% |
| Senegalese | 1.9 /100 | #241 | Tragic 84.0% |
| Sri Lankans | 1.9 /100 | #242 | Tragic 84.0% |
| Cherokee | 1.3 /100 | #243 | Tragic 83.9% |
| Immigrants | Ghana | 1.3 /100 | #244 | Tragic 83.9% |
| Immigrants | Senegal | 1.2 /100 | #245 | Tragic 83.8% |
| Chickasaw | 1.2 /100 | #246 | Tragic 83.8% |
| Immigrants | Western Africa | 1.1 /100 | #247 | Tragic 83.8% |
| Blackfeet | 1.1 /100 | #248 | Tragic 83.8% |
| Crow | 1.1 /100 | #249 | Tragic 83.8% |
Demographics Similar to Immigrants from Scotland by GED/Equivalency
In terms of ged/equivalency, the demographic groups most similar to Immigrants from Scotland are Cambodian (88.2%, a difference of 0.0%), Finnish (88.2%, a difference of 0.030%), Macedonian (88.1%, a difference of 0.030%), Italian (88.2%, a difference of 0.050%), and Immigrants from Israel (88.2%, a difference of 0.070%).
| Demographics | Rating | Rank | GED/Equivalency |
| Immigrants | Belgium | 99.7 /100 | #36 | Exceptional 88.3% |
| Immigrants | Austria | 99.7 /100 | #37 | Exceptional 88.3% |
| Burmese | 99.7 /100 | #38 | Exceptional 88.3% |
| Immigrants | Israel | 99.6 /100 | #39 | Exceptional 88.2% |
| Italians | 99.6 /100 | #40 | Exceptional 88.2% |
| Finns | 99.6 /100 | #41 | Exceptional 88.2% |
| Cambodians | 99.6 /100 | #42 | Exceptional 88.2% |
| Immigrants | Scotland | 99.6 /100 | #43 | Exceptional 88.2% |
| Macedonians | 99.5 /100 | #44 | Exceptional 88.1% |
| Czechs | 99.5 /100 | #45 | Exceptional 88.1% |
| Immigrants | Switzerland | 99.5 /100 | #46 | Exceptional 88.1% |
| Immigrants | Latvia | 99.5 /100 | #47 | Exceptional 88.1% |
| Greeks | 99.5 /100 | #48 | Exceptional 88.1% |
| Australians | 99.5 /100 | #49 | Exceptional 88.1% |
| Immigrants | Korea | 99.5 /100 | #50 | Exceptional 88.1% |