Spaniard vs Immigrants from Poland Bachelor's Degree
COMPARE
Spaniard
Immigrants from Poland
Bachelor's Degree
Bachelor's Degree Comparison
Spaniards
Immigrants from Poland
36.6%
BACHELOR'S DEGREE
21.2/ 100
METRIC RATING
206th/ 347
METRIC RANK
39.0%
BACHELOR'S DEGREE
77.5/ 100
METRIC RATING
149th/ 347
METRIC RANK
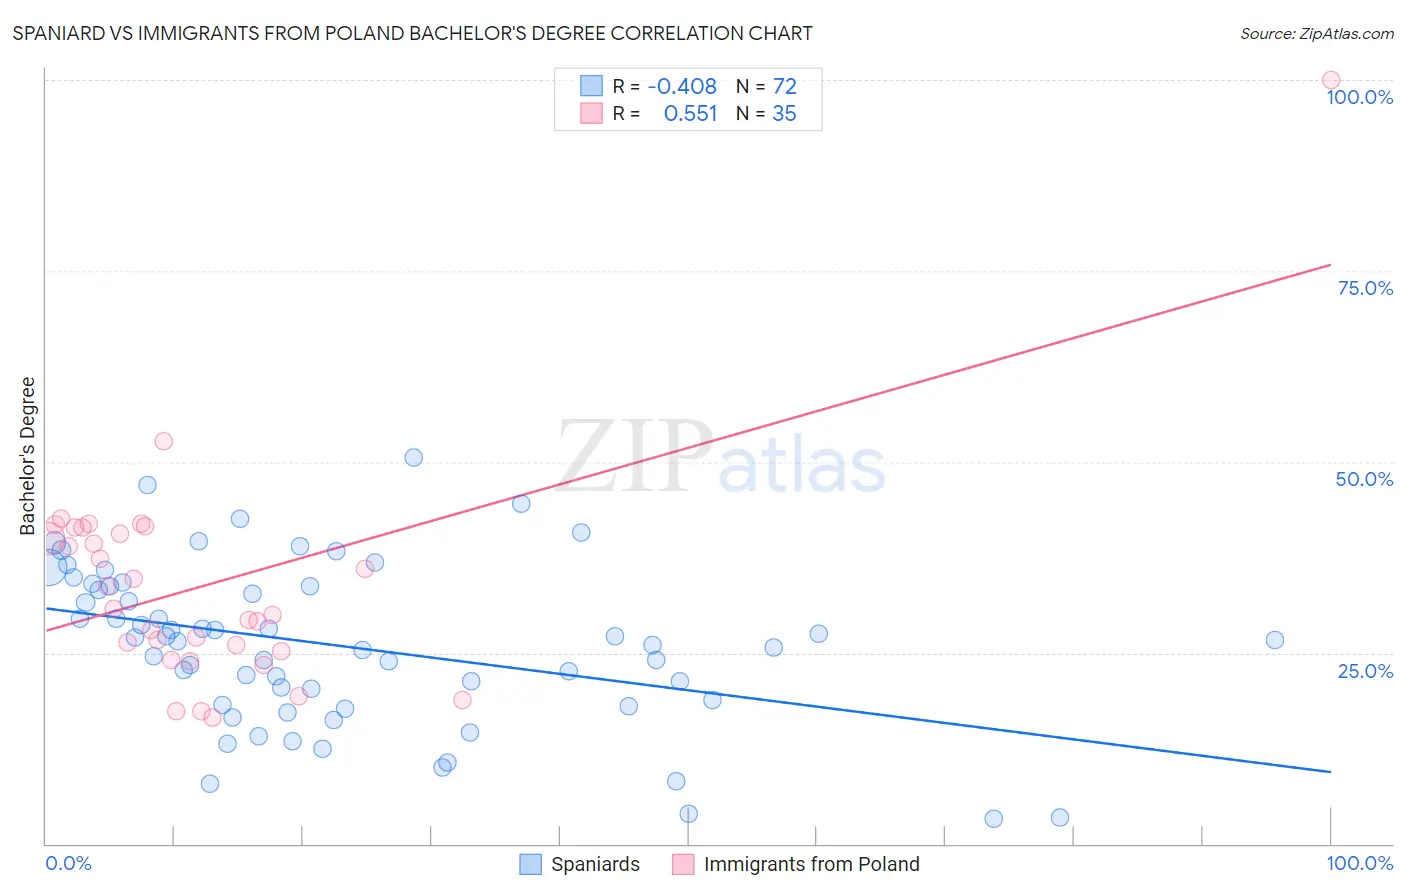
Spaniard vs Immigrants from Poland Bachelor's Degree Correlation Chart
The statistical analysis conducted on geographies consisting of 443,489,635 people shows a moderate negative correlation between the proportion of Spaniards and percentage of population with at least bachelor's degree education in the United States with a correlation coefficient (R) of -0.408 and weighted average of 36.6%. Similarly, the statistical analysis conducted on geographies consisting of 304,854,598 people shows a substantial positive correlation between the proportion of Immigrants from Poland and percentage of population with at least bachelor's degree education in the United States with a correlation coefficient (R) of 0.551 and weighted average of 39.0%, a difference of 6.4%.
Bachelor's Degree Correlation Summary
| Measurement | Spaniard | Immigrants from Poland |
| Minimum | 3.3% | 16.6% |
| Maximum | 50.5% | 100.0% |
| Range | 47.2% | 83.4% |
| Mean | 25.9% | 33.8% |
| Median | 26.6% | 30.8% |
| Interquartile 25% (IQ1) | 18.4% | 25.2% |
| Interquartile 75% (IQ3) | 33.7% | 41.4% |
| Interquartile Range (IQR) | 15.3% | 16.2% |
| Standard Deviation (Sample) | 10.5% | 14.7% |
| Standard Deviation (Population) | 10.4% | 14.5% |
Similar Demographics by Bachelor's Degree
Demographics Similar to Spaniards by Bachelor's Degree
In terms of bachelor's degree, the demographic groups most similar to Spaniards are Immigrants from Middle Africa (36.6%, a difference of 0.090%), Finnish (36.7%, a difference of 0.14%), Immigrants (36.7%, a difference of 0.24%), Immigrants from Nigeria (36.7%, a difference of 0.28%), and Immigrants from Thailand (36.5%, a difference of 0.28%).
| Demographics | Rating | Rank | Bachelor's Degree |
| Immigrants | Costa Rica | 27.4 /100 | #199 | Fair 36.9% |
| Immigrants | Ghana | 27.4 /100 | #200 | Fair 36.9% |
| Immigrants | South Eastern Asia | 25.4 /100 | #201 | Fair 36.8% |
| Immigrants | Zaire | 25.3 /100 | #202 | Fair 36.8% |
| Immigrants | Nigeria | 23.1 /100 | #203 | Fair 36.7% |
| Immigrants | Immigrants | 22.8 /100 | #204 | Fair 36.7% |
| Finns | 22.2 /100 | #205 | Fair 36.7% |
| Spaniards | 21.2 /100 | #206 | Fair 36.6% |
| Immigrants | Middle Africa | 20.6 /100 | #207 | Fair 36.6% |
| Immigrants | Thailand | 19.4 /100 | #208 | Poor 36.5% |
| Panamanians | 18.8 /100 | #209 | Poor 36.5% |
| French | 18.6 /100 | #210 | Poor 36.5% |
| Scotch-Irish | 18.3 /100 | #211 | Poor 36.4% |
| Immigrants | Philippines | 17.8 /100 | #212 | Poor 36.4% |
| Immigrants | Panama | 14.2 /100 | #213 | Poor 36.2% |
Demographics Similar to Immigrants from Poland by Bachelor's Degree
In terms of bachelor's degree, the demographic groups most similar to Immigrants from Poland are South American (38.9%, a difference of 0.030%), Iraqi (39.0%, a difference of 0.080%), Immigrants from Africa (38.9%, a difference of 0.13%), Sudanese (38.9%, a difference of 0.15%), and Slavic (38.9%, a difference of 0.20%).
| Demographics | Rating | Rank | Bachelor's Degree |
| Immigrants | North Macedonia | 81.6 /100 | #142 | Excellent 39.2% |
| Poles | 79.8 /100 | #143 | Good 39.1% |
| Immigrants | Afghanistan | 79.7 /100 | #144 | Good 39.1% |
| Slovenes | 79.5 /100 | #145 | Good 39.1% |
| Swedes | 79.2 /100 | #146 | Good 39.1% |
| Immigrants | Sierra Leone | 79.0 /100 | #147 | Good 39.0% |
| Iraqis | 78.1 /100 | #148 | Good 39.0% |
| Immigrants | Poland | 77.5 /100 | #149 | Good 39.0% |
| South Americans | 77.3 /100 | #150 | Good 38.9% |
| Immigrants | Africa | 76.5 /100 | #151 | Good 38.9% |
| Sudanese | 76.4 /100 | #152 | Good 38.9% |
| Slavs | 75.9 /100 | #153 | Good 38.9% |
| Canadians | 75.0 /100 | #154 | Good 38.8% |
| Immigrants | Kenya | 73.8 /100 | #155 | Good 38.8% |
| Kenyans | 72.5 /100 | #156 | Good 38.7% |