Spaniard vs Immigrants from Chile Bachelor's Degree
COMPARE
Spaniard
Immigrants from Chile
Bachelor's Degree
Bachelor's Degree Comparison
Spaniards
Immigrants from Chile
36.6%
BACHELOR'S DEGREE
21.2/ 100
METRIC RATING
206th/ 347
METRIC RANK
40.8%
BACHELOR'S DEGREE
96.4/ 100
METRIC RATING
111th/ 347
METRIC RANK
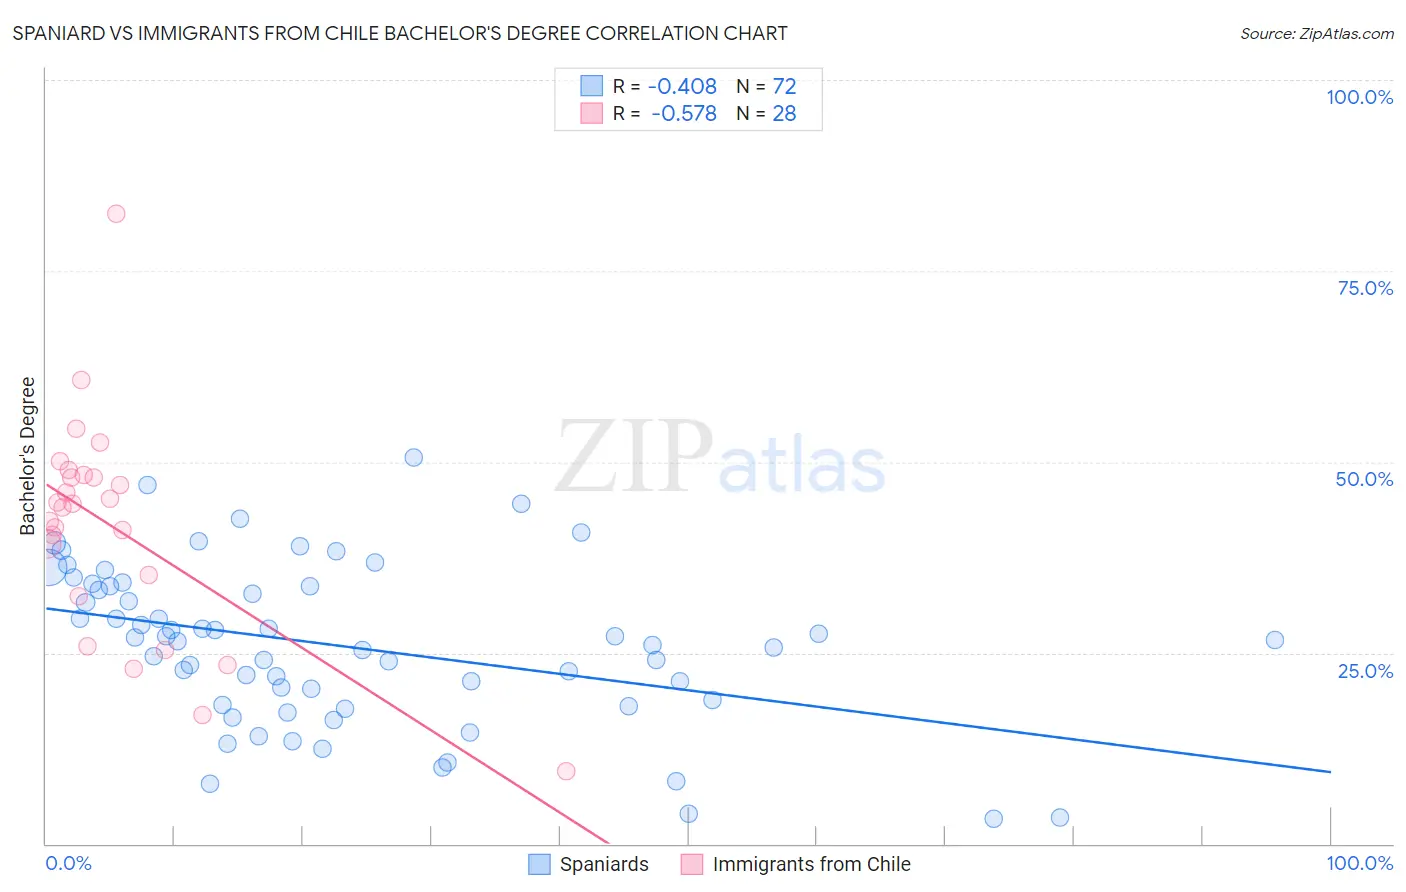
Spaniard vs Immigrants from Chile Bachelor's Degree Correlation Chart
The statistical analysis conducted on geographies consisting of 443,489,635 people shows a moderate negative correlation between the proportion of Spaniards and percentage of population with at least bachelor's degree education in the United States with a correlation coefficient (R) of -0.408 and weighted average of 36.6%. Similarly, the statistical analysis conducted on geographies consisting of 218,646,599 people shows a substantial negative correlation between the proportion of Immigrants from Chile and percentage of population with at least bachelor's degree education in the United States with a correlation coefficient (R) of -0.578 and weighted average of 40.8%, a difference of 11.6%.
Bachelor's Degree Correlation Summary
| Measurement | Spaniard | Immigrants from Chile |
| Minimum | 3.3% | 9.5% |
| Maximum | 50.5% | 82.5% |
| Range | 47.2% | 72.9% |
| Mean | 25.9% | 41.4% |
| Median | 26.6% | 44.3% |
| Interquartile 25% (IQ1) | 18.4% | 33.8% |
| Interquartile 75% (IQ3) | 33.7% | 48.1% |
| Interquartile Range (IQR) | 15.3% | 14.3% |
| Standard Deviation (Sample) | 10.5% | 14.4% |
| Standard Deviation (Population) | 10.4% | 14.2% |
Similar Demographics by Bachelor's Degree
Demographics Similar to Spaniards by Bachelor's Degree
In terms of bachelor's degree, the demographic groups most similar to Spaniards are Immigrants from Middle Africa (36.6%, a difference of 0.090%), Finnish (36.7%, a difference of 0.14%), Immigrants (36.7%, a difference of 0.24%), Immigrants from Nigeria (36.7%, a difference of 0.28%), and Immigrants from Thailand (36.5%, a difference of 0.28%).
| Demographics | Rating | Rank | Bachelor's Degree |
| Immigrants | Costa Rica | 27.4 /100 | #199 | Fair 36.9% |
| Immigrants | Ghana | 27.4 /100 | #200 | Fair 36.9% |
| Immigrants | South Eastern Asia | 25.4 /100 | #201 | Fair 36.8% |
| Immigrants | Zaire | 25.3 /100 | #202 | Fair 36.8% |
| Immigrants | Nigeria | 23.1 /100 | #203 | Fair 36.7% |
| Immigrants | Immigrants | 22.8 /100 | #204 | Fair 36.7% |
| Finns | 22.2 /100 | #205 | Fair 36.7% |
| Spaniards | 21.2 /100 | #206 | Fair 36.6% |
| Immigrants | Middle Africa | 20.6 /100 | #207 | Fair 36.6% |
| Immigrants | Thailand | 19.4 /100 | #208 | Poor 36.5% |
| Panamanians | 18.8 /100 | #209 | Poor 36.5% |
| French | 18.6 /100 | #210 | Poor 36.5% |
| Scotch-Irish | 18.3 /100 | #211 | Poor 36.4% |
| Immigrants | Philippines | 17.8 /100 | #212 | Poor 36.4% |
| Immigrants | Panama | 14.2 /100 | #213 | Poor 36.2% |
Demographics Similar to Immigrants from Chile by Bachelor's Degree
In terms of bachelor's degree, the demographic groups most similar to Immigrants from Chile are Albanian (40.9%, a difference of 0.050%), Ugandan (40.8%, a difference of 0.050%), Brazilian (40.8%, a difference of 0.090%), Arab (40.9%, a difference of 0.12%), and Afghan (40.8%, a difference of 0.12%).
| Demographics | Rating | Rank | Bachelor's Degree |
| Jordanians | 97.4 /100 | #104 | Exceptional 41.2% |
| Syrians | 97.4 /100 | #105 | Exceptional 41.1% |
| Alsatians | 97.0 /100 | #106 | Exceptional 41.0% |
| Northern Europeans | 96.8 /100 | #107 | Exceptional 41.0% |
| Ukrainians | 96.6 /100 | #108 | Exceptional 40.9% |
| Arabs | 96.6 /100 | #109 | Exceptional 40.9% |
| Albanians | 96.5 /100 | #110 | Exceptional 40.9% |
| Immigrants | Chile | 96.4 /100 | #111 | Exceptional 40.8% |
| Ugandans | 96.3 /100 | #112 | Exceptional 40.8% |
| Brazilians | 96.3 /100 | #113 | Exceptional 40.8% |
| Afghans | 96.2 /100 | #114 | Exceptional 40.8% |
| Palestinians | 95.8 /100 | #115 | Exceptional 40.7% |
| Immigrants | Uganda | 95.7 /100 | #116 | Exceptional 40.7% |
| Austrians | 95.5 /100 | #117 | Exceptional 40.6% |
| Croatians | 95.5 /100 | #118 | Exceptional 40.6% |