Spaniard vs Immigrants from Poland 4th Grade
COMPARE
Spaniard
Immigrants from Poland
4th Grade
4th Grade Comparison
Spaniards
Immigrants from Poland
97.7%
4TH GRADE
82.7/ 100
METRIC RATING
144th/ 347
METRIC RANK
97.5%
4TH GRADE
55.9/ 100
METRIC RATING
167th/ 347
METRIC RANK
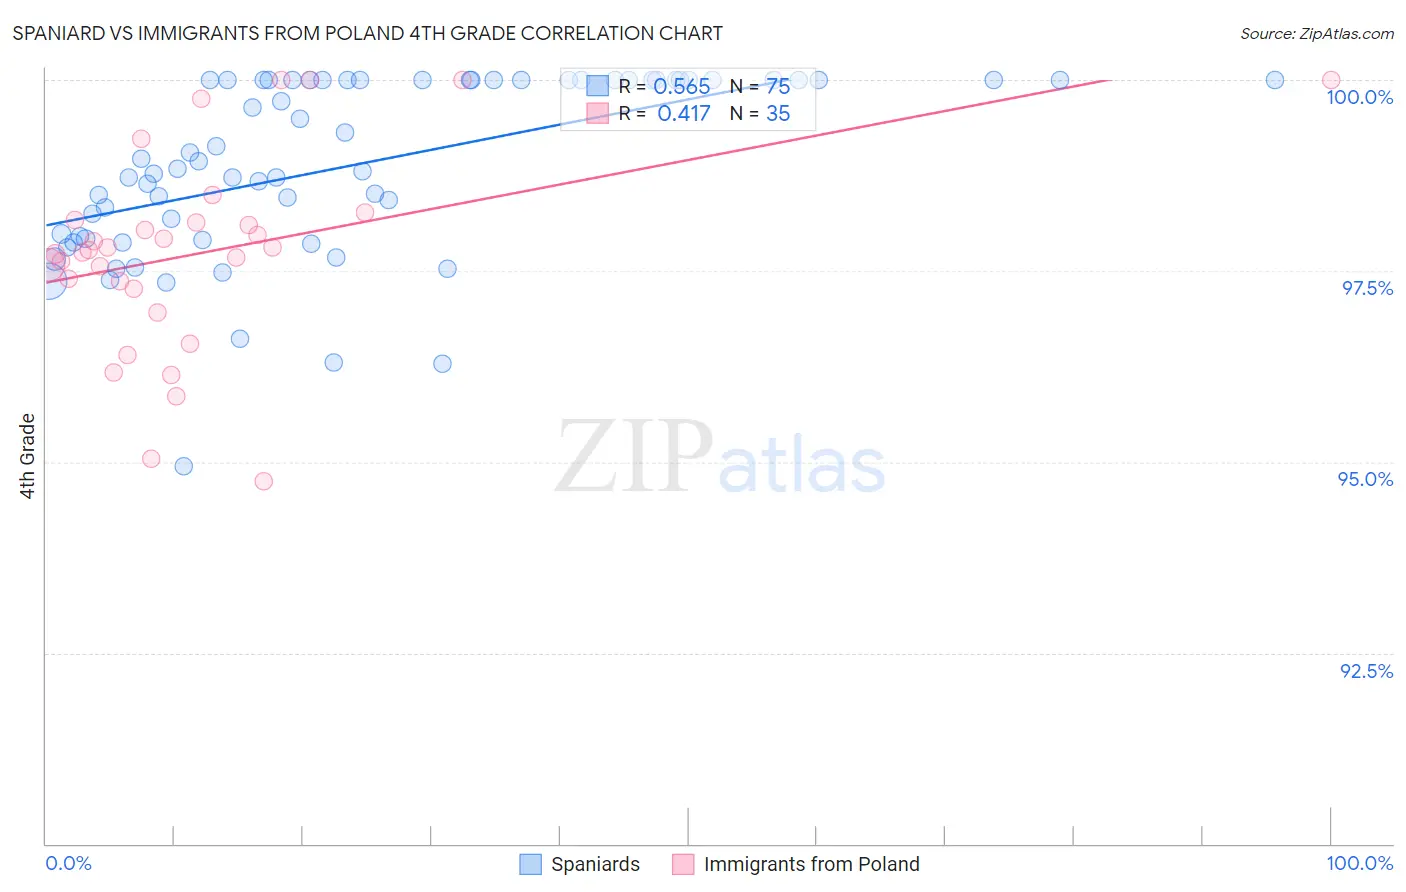
Spaniard vs Immigrants from Poland 4th Grade Correlation Chart
The statistical analysis conducted on geographies consisting of 443,544,503 people shows a substantial positive correlation between the proportion of Spaniards and percentage of population with at least 4th grade education in the United States with a correlation coefficient (R) of 0.565 and weighted average of 97.7%. Similarly, the statistical analysis conducted on geographies consisting of 304,861,559 people shows a moderate positive correlation between the proportion of Immigrants from Poland and percentage of population with at least 4th grade education in the United States with a correlation coefficient (R) of 0.417 and weighted average of 97.5%, a difference of 0.13%.
4th Grade Correlation Summary
| Measurement | Spaniard | Immigrants from Poland |
| Minimum | 94.9% | 94.8% |
| Maximum | 100.0% | 100.0% |
| Range | 5.1% | 5.2% |
| Mean | 98.9% | 97.7% |
| Median | 98.9% | 97.8% |
| Interquartile 25% (IQ1) | 97.9% | 97.3% |
| Interquartile 75% (IQ3) | 100.0% | 98.2% |
| Interquartile Range (IQR) | 2.1% | 0.90% |
| Standard Deviation (Sample) | 1.2% | 1.3% |
| Standard Deviation (Population) | 1.2% | 1.3% |
Similar Demographics by 4th Grade
Demographics Similar to Spaniards by 4th Grade
In terms of 4th grade, the demographic groups most similar to Spaniards are Immigrants from North Macedonia (97.7%, a difference of 0.0%), Burmese (97.7%, a difference of 0.0%), Immigrants from Moldova (97.7%, a difference of 0.0%), Seminole (97.7%, a difference of 0.010%), and Filipino (97.7%, a difference of 0.010%).
| Demographics | Rating | Rank | 4th Grade |
| Immigrants | Turkey | 86.0 /100 | #137 | Excellent 97.7% |
| Blackfeet | 86.0 /100 | #138 | Excellent 97.7% |
| Seminole | 84.7 /100 | #139 | Excellent 97.7% |
| Filipinos | 84.0 /100 | #140 | Excellent 97.7% |
| Immigrants | Greece | 83.8 /100 | #141 | Excellent 97.7% |
| Immigrants | North Macedonia | 83.3 /100 | #142 | Excellent 97.7% |
| Burmese | 82.8 /100 | #143 | Excellent 97.7% |
| Spaniards | 82.7 /100 | #144 | Excellent 97.7% |
| Immigrants | Moldova | 82.4 /100 | #145 | Excellent 97.7% |
| Jordanians | 81.3 /100 | #146 | Excellent 97.7% |
| Ute | 80.6 /100 | #147 | Excellent 97.7% |
| Hopi | 80.6 /100 | #148 | Excellent 97.7% |
| Soviet Union | 77.8 /100 | #149 | Good 97.6% |
| Immigrants | Israel | 77.7 /100 | #150 | Good 97.6% |
| Alsatians | 77.2 /100 | #151 | Good 97.6% |
Demographics Similar to Immigrants from Poland by 4th Grade
In terms of 4th grade, the demographic groups most similar to Immigrants from Poland are Kenyan (97.5%, a difference of 0.0%), Immigrants from Belarus (97.5%, a difference of 0.0%), Ugandan (97.6%, a difference of 0.010%), Venezuelan (97.6%, a difference of 0.010%), and Chilean (97.5%, a difference of 0.010%).
| Demographics | Rating | Rank | 4th Grade |
| Apache | 61.3 /100 | #160 | Good 97.6% |
| Marshallese | 60.8 /100 | #161 | Good 97.6% |
| Bermudans | 60.5 /100 | #162 | Good 97.6% |
| Immigrants | Iran | 60.3 /100 | #163 | Good 97.6% |
| Ugandans | 58.9 /100 | #164 | Average 97.6% |
| Venezuelans | 58.7 /100 | #165 | Average 97.6% |
| Kenyans | 56.5 /100 | #166 | Average 97.5% |
| Immigrants | Poland | 55.9 /100 | #167 | Average 97.5% |
| Immigrants | Belarus | 55.8 /100 | #168 | Average 97.5% |
| Chileans | 54.4 /100 | #169 | Average 97.5% |
| Immigrants | Spain | 51.8 /100 | #170 | Average 97.5% |
| Brazilians | 51.5 /100 | #171 | Average 97.5% |
| Immigrants | Sri Lanka | 51.1 /100 | #172 | Average 97.5% |
| Immigrants | Korea | 50.6 /100 | #173 | Average 97.5% |
| Egyptians | 50.0 /100 | #174 | Average 97.5% |