Immigrants from Brazil vs Immigrants from Poland Bachelor's Degree
COMPARE
Immigrants from Brazil
Immigrants from Poland
Bachelor's Degree
Bachelor's Degree Comparison
Immigrants from Brazil
Immigrants from Poland
42.2%
BACHELOR'S DEGREE
99.2/ 100
METRIC RATING
86th/ 347
METRIC RANK
39.0%
BACHELOR'S DEGREE
77.5/ 100
METRIC RATING
149th/ 347
METRIC RANK
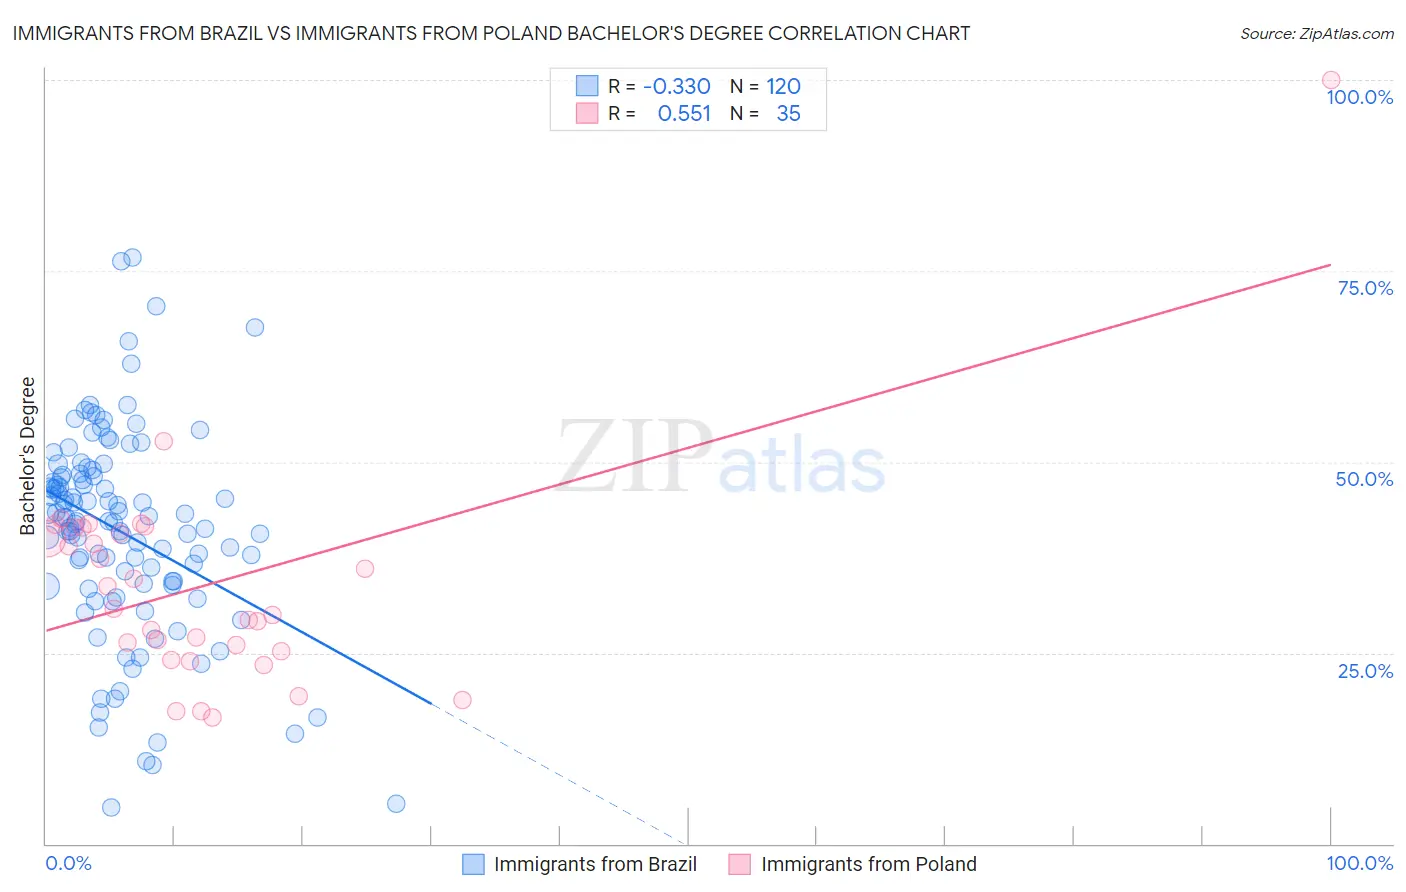
Immigrants from Brazil vs Immigrants from Poland Bachelor's Degree Correlation Chart
The statistical analysis conducted on geographies consisting of 342,997,196 people shows a mild negative correlation between the proportion of Immigrants from Brazil and percentage of population with at least bachelor's degree education in the United States with a correlation coefficient (R) of -0.330 and weighted average of 42.2%. Similarly, the statistical analysis conducted on geographies consisting of 304,854,598 people shows a substantial positive correlation between the proportion of Immigrants from Poland and percentage of population with at least bachelor's degree education in the United States with a correlation coefficient (R) of 0.551 and weighted average of 39.0%, a difference of 8.4%.
Bachelor's Degree Correlation Summary
| Measurement | Immigrants from Brazil | Immigrants from Poland |
| Minimum | 4.8% | 16.6% |
| Maximum | 76.8% | 100.0% |
| Range | 72.0% | 83.4% |
| Mean | 40.8% | 33.8% |
| Median | 42.2% | 30.8% |
| Interquartile 25% (IQ1) | 33.9% | 25.2% |
| Interquartile 75% (IQ3) | 48.3% | 41.4% |
| Interquartile Range (IQR) | 14.3% | 16.2% |
| Standard Deviation (Sample) | 13.5% | 14.7% |
| Standard Deviation (Population) | 13.5% | 14.5% |
Similar Demographics by Bachelor's Degree
Demographics Similar to Immigrants from Brazil by Bachelor's Degree
In terms of bachelor's degree, the demographic groups most similar to Immigrants from Brazil are Lithuanian (42.2%, a difference of 0.080%), Immigrants from Western Asia (42.3%, a difference of 0.11%), Armenian (42.3%, a difference of 0.12%), Immigrants from Scotland (42.3%, a difference of 0.15%), and Immigrants from Hungary (42.3%, a difference of 0.22%).
| Demographics | Rating | Rank | Bachelor's Degree |
| Immigrants | Lebanon | 99.3 /100 | #79 | Exceptional 42.4% |
| Immigrants | Croatia | 99.2 /100 | #80 | Exceptional 42.3% |
| Immigrants | Hungary | 99.2 /100 | #81 | Exceptional 42.3% |
| Immigrants | Scotland | 99.2 /100 | #82 | Exceptional 42.3% |
| Armenians | 99.2 /100 | #83 | Exceptional 42.3% |
| Immigrants | Western Asia | 99.2 /100 | #84 | Exceptional 42.3% |
| Lithuanians | 99.2 /100 | #85 | Exceptional 42.2% |
| Immigrants | Brazil | 99.2 /100 | #86 | Exceptional 42.2% |
| Carpatho Rusyns | 99.0 /100 | #87 | Exceptional 42.1% |
| Immigrants | Western Europe | 99.0 /100 | #88 | Exceptional 42.0% |
| Greeks | 99.0 /100 | #89 | Exceptional 42.0% |
| Laotians | 98.9 /100 | #90 | Exceptional 42.0% |
| Immigrants | Northern Africa | 98.9 /100 | #91 | Exceptional 41.9% |
| Maltese | 98.8 /100 | #92 | Exceptional 41.9% |
| Immigrants | Canada | 98.6 /100 | #93 | Exceptional 41.7% |
Demographics Similar to Immigrants from Poland by Bachelor's Degree
In terms of bachelor's degree, the demographic groups most similar to Immigrants from Poland are South American (38.9%, a difference of 0.030%), Iraqi (39.0%, a difference of 0.080%), Immigrants from Africa (38.9%, a difference of 0.13%), Sudanese (38.9%, a difference of 0.15%), and Slavic (38.9%, a difference of 0.20%).
| Demographics | Rating | Rank | Bachelor's Degree |
| Immigrants | North Macedonia | 81.6 /100 | #142 | Excellent 39.2% |
| Poles | 79.8 /100 | #143 | Good 39.1% |
| Immigrants | Afghanistan | 79.7 /100 | #144 | Good 39.1% |
| Slovenes | 79.5 /100 | #145 | Good 39.1% |
| Swedes | 79.2 /100 | #146 | Good 39.1% |
| Immigrants | Sierra Leone | 79.0 /100 | #147 | Good 39.0% |
| Iraqis | 78.1 /100 | #148 | Good 39.0% |
| Immigrants | Poland | 77.5 /100 | #149 | Good 39.0% |
| South Americans | 77.3 /100 | #150 | Good 38.9% |
| Immigrants | Africa | 76.5 /100 | #151 | Good 38.9% |
| Sudanese | 76.4 /100 | #152 | Good 38.9% |
| Slavs | 75.9 /100 | #153 | Good 38.9% |
| Canadians | 75.0 /100 | #154 | Good 38.8% |
| Immigrants | Kenya | 73.8 /100 | #155 | Good 38.8% |
| Kenyans | 72.5 /100 | #156 | Good 38.7% |