Jordanian vs Immigrants from Poland Bachelor's Degree
COMPARE
Jordanian
Immigrants from Poland
Bachelor's Degree
Bachelor's Degree Comparison
Jordanians
Immigrants from Poland
41.2%
BACHELOR'S DEGREE
97.4/ 100
METRIC RATING
104th/ 347
METRIC RANK
39.0%
BACHELOR'S DEGREE
77.5/ 100
METRIC RATING
149th/ 347
METRIC RANK
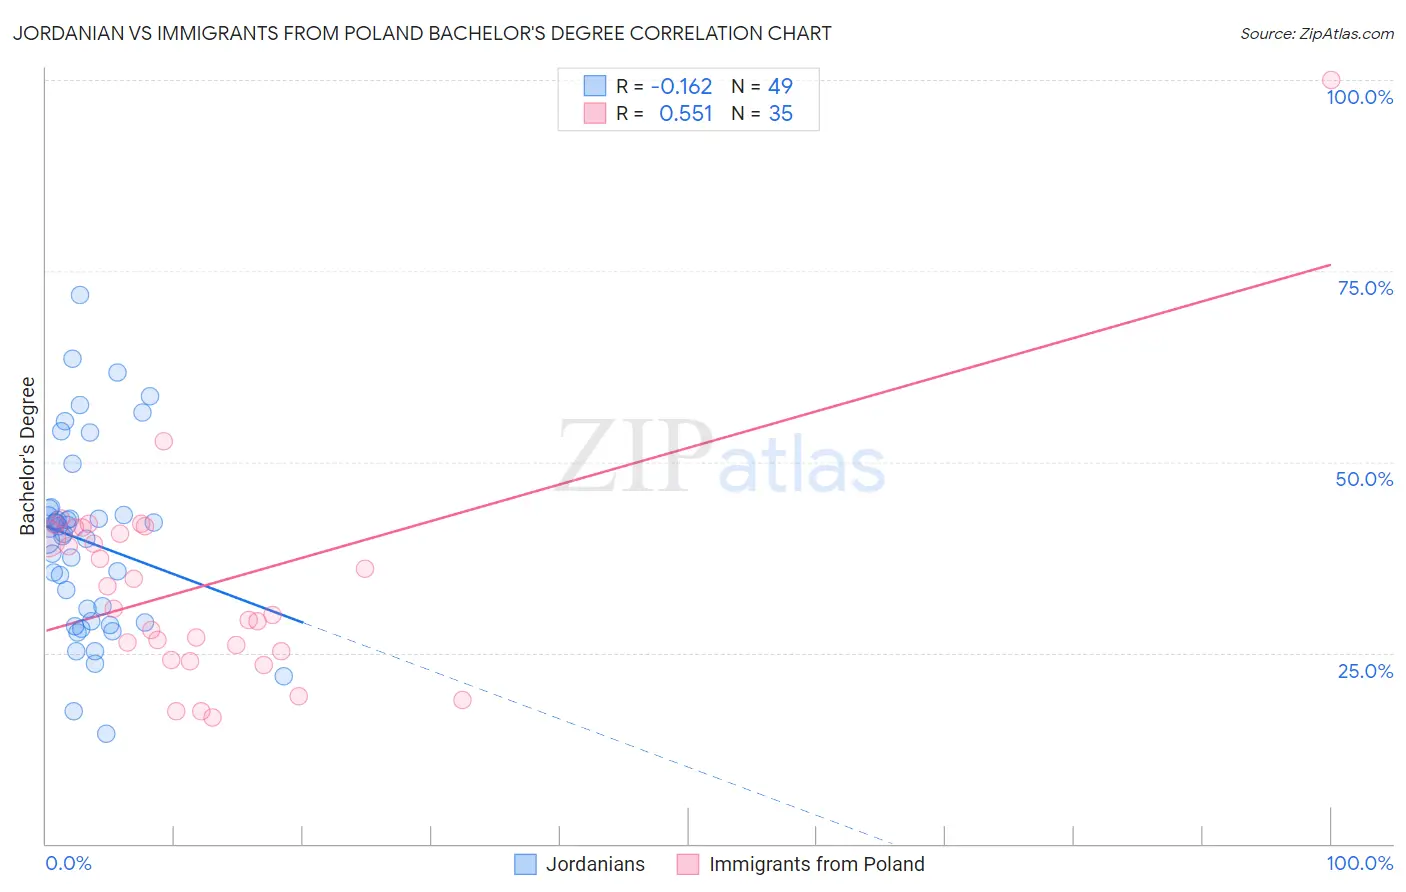
Jordanian vs Immigrants from Poland Bachelor's Degree Correlation Chart
The statistical analysis conducted on geographies consisting of 166,421,482 people shows a poor negative correlation between the proportion of Jordanians and percentage of population with at least bachelor's degree education in the United States with a correlation coefficient (R) of -0.162 and weighted average of 41.2%. Similarly, the statistical analysis conducted on geographies consisting of 304,854,598 people shows a substantial positive correlation between the proportion of Immigrants from Poland and percentage of population with at least bachelor's degree education in the United States with a correlation coefficient (R) of 0.551 and weighted average of 39.0%, a difference of 5.6%.
Bachelor's Degree Correlation Summary
| Measurement | Jordanian | Immigrants from Poland |
| Minimum | 14.4% | 16.6% |
| Maximum | 71.8% | 100.0% |
| Range | 57.4% | 83.4% |
| Mean | 39.6% | 33.8% |
| Median | 40.5% | 30.8% |
| Interquartile 25% (IQ1) | 29.1% | 25.2% |
| Interquartile 75% (IQ3) | 43.4% | 41.4% |
| Interquartile Range (IQR) | 14.3% | 16.2% |
| Standard Deviation (Sample) | 12.2% | 14.7% |
| Standard Deviation (Population) | 12.1% | 14.5% |
Similar Demographics by Bachelor's Degree
Demographics Similar to Jordanians by Bachelor's Degree
In terms of bachelor's degree, the demographic groups most similar to Jordanians are Syrian (41.1%, a difference of 0.030%), Chilean (41.2%, a difference of 0.060%), Alsatian (41.0%, a difference of 0.29%), Immigrants from Italy (41.3%, a difference of 0.40%), and Northern European (41.0%, a difference of 0.46%).
| Demographics | Rating | Rank | Bachelor's Degree |
| Romanians | 98.4 /100 | #97 | Exceptional 41.6% |
| Immigrants | Ukraine | 98.3 /100 | #98 | Exceptional 41.5% |
| Immigrants | England | 98.1 /100 | #99 | Exceptional 41.4% |
| Macedonians | 98.1 /100 | #100 | Exceptional 41.4% |
| Immigrants | Morocco | 98.0 /100 | #101 | Exceptional 41.4% |
| Immigrants | Italy | 97.8 /100 | #102 | Exceptional 41.3% |
| Chileans | 97.5 /100 | #103 | Exceptional 41.2% |
| Jordanians | 97.4 /100 | #104 | Exceptional 41.2% |
| Syrians | 97.4 /100 | #105 | Exceptional 41.1% |
| Alsatians | 97.0 /100 | #106 | Exceptional 41.0% |
| Northern Europeans | 96.8 /100 | #107 | Exceptional 41.0% |
| Ukrainians | 96.6 /100 | #108 | Exceptional 40.9% |
| Arabs | 96.6 /100 | #109 | Exceptional 40.9% |
| Albanians | 96.5 /100 | #110 | Exceptional 40.9% |
| Immigrants | Chile | 96.4 /100 | #111 | Exceptional 40.8% |
Demographics Similar to Immigrants from Poland by Bachelor's Degree
In terms of bachelor's degree, the demographic groups most similar to Immigrants from Poland are South American (38.9%, a difference of 0.030%), Iraqi (39.0%, a difference of 0.080%), Immigrants from Africa (38.9%, a difference of 0.13%), Sudanese (38.9%, a difference of 0.15%), and Slavic (38.9%, a difference of 0.20%).
| Demographics | Rating | Rank | Bachelor's Degree |
| Immigrants | North Macedonia | 81.6 /100 | #142 | Excellent 39.2% |
| Poles | 79.8 /100 | #143 | Good 39.1% |
| Immigrants | Afghanistan | 79.7 /100 | #144 | Good 39.1% |
| Slovenes | 79.5 /100 | #145 | Good 39.1% |
| Swedes | 79.2 /100 | #146 | Good 39.1% |
| Immigrants | Sierra Leone | 79.0 /100 | #147 | Good 39.0% |
| Iraqis | 78.1 /100 | #148 | Good 39.0% |
| Immigrants | Poland | 77.5 /100 | #149 | Good 39.0% |
| South Americans | 77.3 /100 | #150 | Good 38.9% |
| Immigrants | Africa | 76.5 /100 | #151 | Good 38.9% |
| Sudanese | 76.4 /100 | #152 | Good 38.9% |
| Slavs | 75.9 /100 | #153 | Good 38.9% |
| Canadians | 75.0 /100 | #154 | Good 38.8% |
| Immigrants | Kenya | 73.8 /100 | #155 | Good 38.8% |
| Kenyans | 72.5 /100 | #156 | Good 38.7% |