Cheyenne vs Immigrants from Poland Bachelor's Degree
COMPARE
Cheyenne
Immigrants from Poland
Bachelor's Degree
Bachelor's Degree Comparison
Cheyenne
Immigrants from Poland
29.4%
BACHELOR'S DEGREE
0.0/ 100
METRIC RATING
310th/ 347
METRIC RANK
39.0%
BACHELOR'S DEGREE
77.5/ 100
METRIC RATING
149th/ 347
METRIC RANK
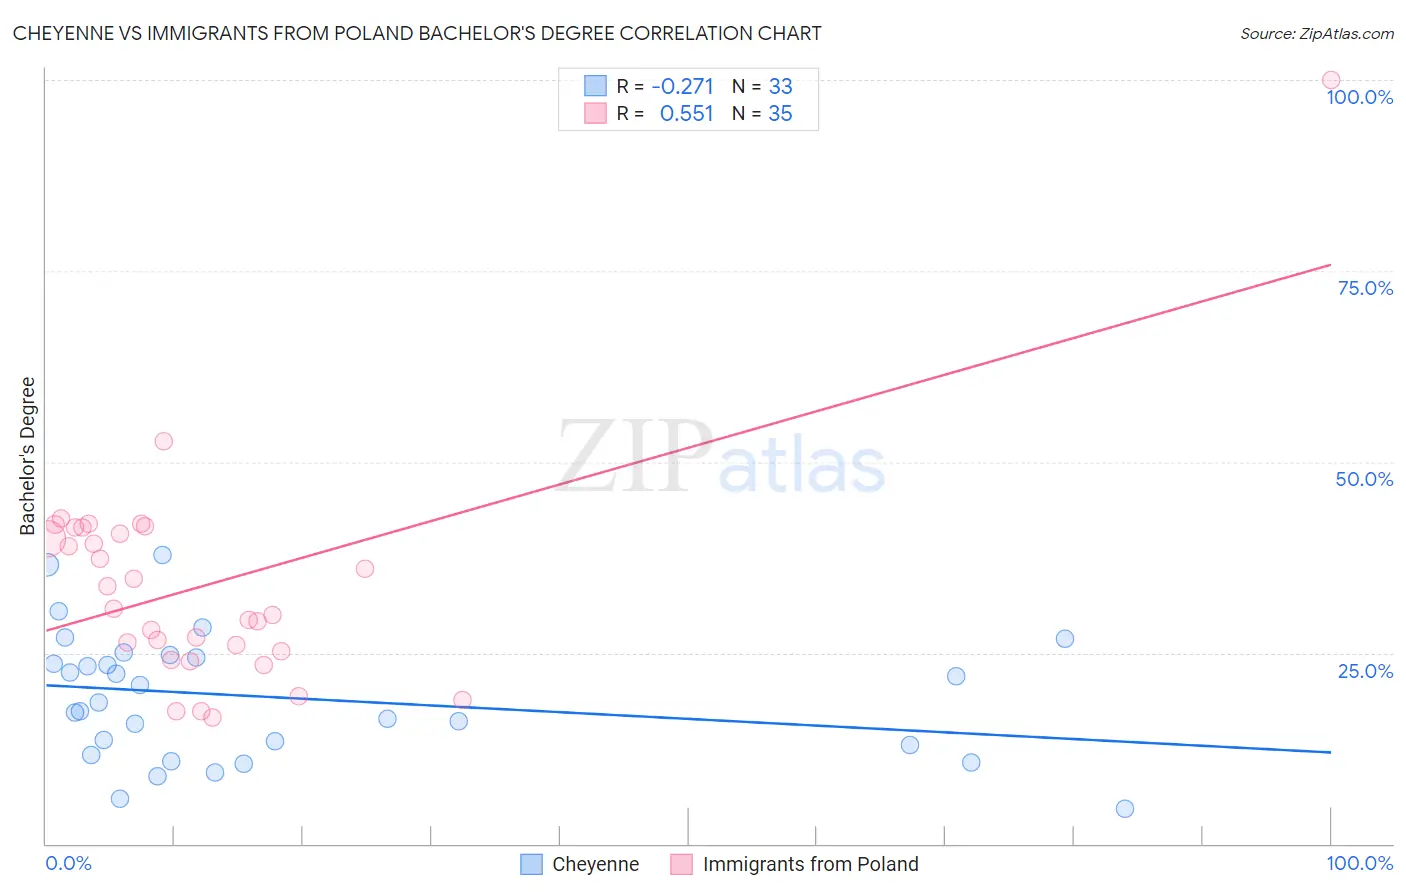
Cheyenne vs Immigrants from Poland Bachelor's Degree Correlation Chart
The statistical analysis conducted on geographies consisting of 80,718,972 people shows a weak negative correlation between the proportion of Cheyenne and percentage of population with at least bachelor's degree education in the United States with a correlation coefficient (R) of -0.271 and weighted average of 29.4%. Similarly, the statistical analysis conducted on geographies consisting of 304,854,598 people shows a substantial positive correlation between the proportion of Immigrants from Poland and percentage of population with at least bachelor's degree education in the United States with a correlation coefficient (R) of 0.551 and weighted average of 39.0%, a difference of 32.3%.
Bachelor's Degree Correlation Summary
| Measurement | Cheyenne | Immigrants from Poland |
| Minimum | 4.6% | 16.6% |
| Maximum | 37.7% | 100.0% |
| Range | 33.1% | 83.4% |
| Mean | 19.1% | 33.8% |
| Median | 18.6% | 30.8% |
| Interquartile 25% (IQ1) | 12.3% | 25.2% |
| Interquartile 75% (IQ3) | 24.6% | 41.4% |
| Interquartile Range (IQR) | 12.3% | 16.2% |
| Standard Deviation (Sample) | 8.2% | 14.7% |
| Standard Deviation (Population) | 8.1% | 14.5% |
Similar Demographics by Bachelor's Degree
Demographics Similar to Cheyenne by Bachelor's Degree
In terms of bachelor's degree, the demographic groups most similar to Cheyenne are Choctaw (29.4%, a difference of 0.070%), Seminole (29.4%, a difference of 0.13%), Alaska Native (29.4%, a difference of 0.31%), Hispanic or Latino (29.6%, a difference of 0.47%), and Shoshone (29.3%, a difference of 0.60%).
| Demographics | Rating | Rank | Bachelor's Degree |
| Bangladeshis | 0.0 /100 | #303 | Tragic 30.2% |
| Cherokee | 0.0 /100 | #304 | Tragic 30.2% |
| Immigrants | Latin America | 0.0 /100 | #305 | Tragic 30.1% |
| Immigrants | Yemen | 0.0 /100 | #306 | Tragic 29.9% |
| Nepalese | 0.0 /100 | #307 | Tragic 29.9% |
| Cajuns | 0.0 /100 | #308 | Tragic 29.6% |
| Hispanics or Latinos | 0.0 /100 | #309 | Tragic 29.6% |
| Cheyenne | 0.0 /100 | #310 | Tragic 29.4% |
| Choctaw | 0.0 /100 | #311 | Tragic 29.4% |
| Seminole | 0.0 /100 | #312 | Tragic 29.4% |
| Alaska Natives | 0.0 /100 | #313 | Tragic 29.4% |
| Shoshone | 0.0 /100 | #314 | Tragic 29.3% |
| Immigrants | Cabo Verde | 0.0 /100 | #315 | Tragic 29.2% |
| Sioux | 0.0 /100 | #316 | Tragic 29.1% |
| Colville | 0.0 /100 | #317 | Tragic 29.0% |
Demographics Similar to Immigrants from Poland by Bachelor's Degree
In terms of bachelor's degree, the demographic groups most similar to Immigrants from Poland are South American (38.9%, a difference of 0.030%), Iraqi (39.0%, a difference of 0.080%), Immigrants from Africa (38.9%, a difference of 0.13%), Sudanese (38.9%, a difference of 0.15%), and Slavic (38.9%, a difference of 0.20%).
| Demographics | Rating | Rank | Bachelor's Degree |
| Immigrants | North Macedonia | 81.6 /100 | #142 | Excellent 39.2% |
| Poles | 79.8 /100 | #143 | Good 39.1% |
| Immigrants | Afghanistan | 79.7 /100 | #144 | Good 39.1% |
| Slovenes | 79.5 /100 | #145 | Good 39.1% |
| Swedes | 79.2 /100 | #146 | Good 39.1% |
| Immigrants | Sierra Leone | 79.0 /100 | #147 | Good 39.0% |
| Iraqis | 78.1 /100 | #148 | Good 39.0% |
| Immigrants | Poland | 77.5 /100 | #149 | Good 39.0% |
| South Americans | 77.3 /100 | #150 | Good 38.9% |
| Immigrants | Africa | 76.5 /100 | #151 | Good 38.9% |
| Sudanese | 76.4 /100 | #152 | Good 38.9% |
| Slavs | 75.9 /100 | #153 | Good 38.9% |
| Canadians | 75.0 /100 | #154 | Good 38.8% |
| Immigrants | Kenya | 73.8 /100 | #155 | Good 38.8% |
| Kenyans | 72.5 /100 | #156 | Good 38.7% |