Spaniard vs Costa Rican Bachelor's Degree
COMPARE
Spaniard
Costa Rican
Bachelor's Degree
Bachelor's Degree Comparison
Spaniards
Costa Ricans
36.6%
BACHELOR'S DEGREE
21.2/ 100
METRIC RATING
206th/ 347
METRIC RANK
37.7%
BACHELOR'S DEGREE
47.6/ 100
METRIC RATING
176th/ 347
METRIC RANK
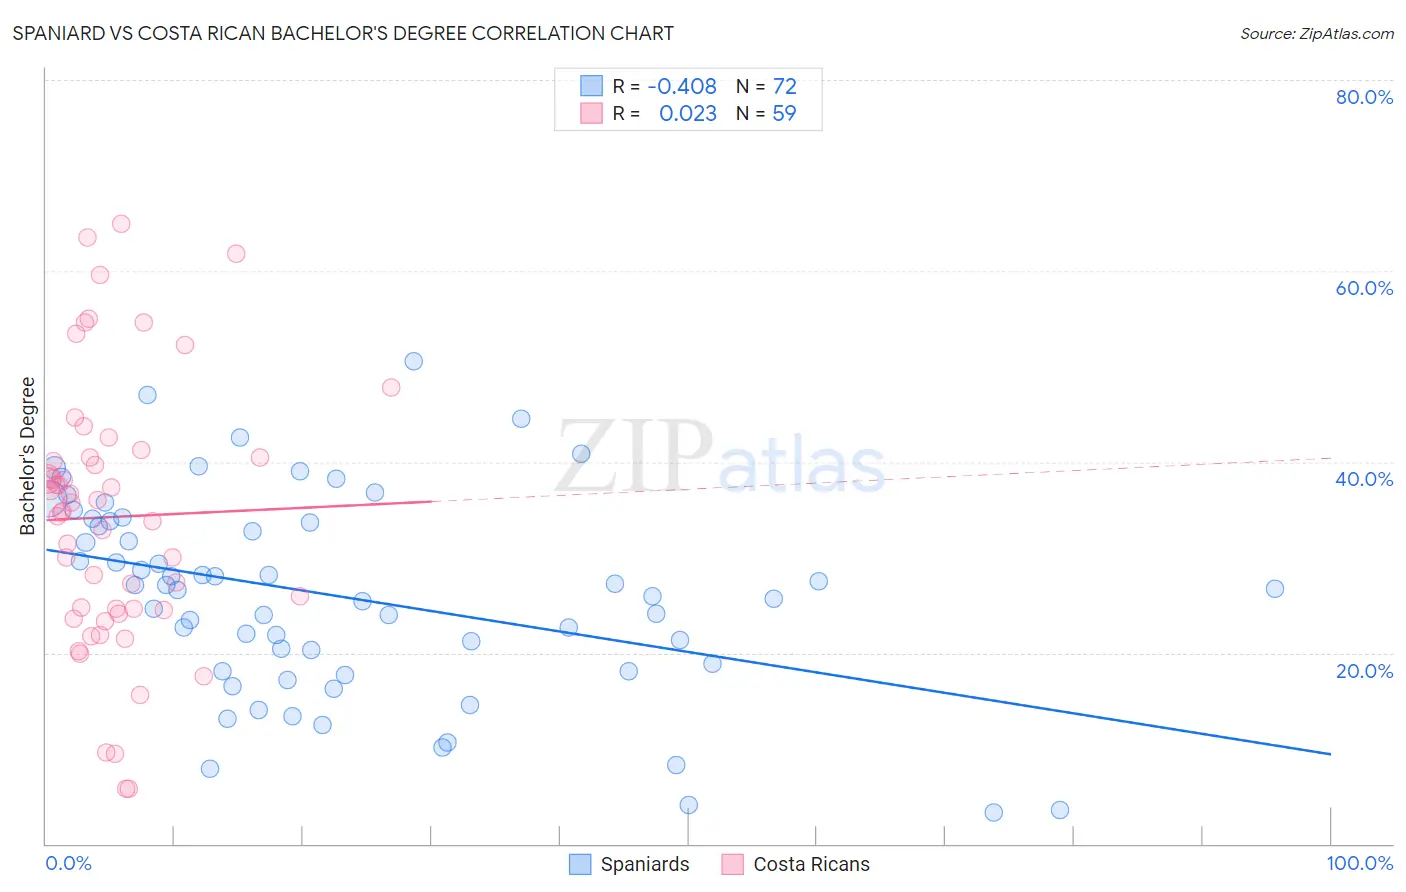
Spaniard vs Costa Rican Bachelor's Degree Correlation Chart
The statistical analysis conducted on geographies consisting of 443,489,635 people shows a moderate negative correlation between the proportion of Spaniards and percentage of population with at least bachelor's degree education in the United States with a correlation coefficient (R) of -0.408 and weighted average of 36.6%. Similarly, the statistical analysis conducted on geographies consisting of 253,595,641 people shows no correlation between the proportion of Costa Ricans and percentage of population with at least bachelor's degree education in the United States with a correlation coefficient (R) of 0.023 and weighted average of 37.7%, a difference of 3.0%.
Bachelor's Degree Correlation Summary
| Measurement | Spaniard | Costa Rican |
| Minimum | 3.3% | 5.7% |
| Maximum | 50.5% | 65.0% |
| Range | 47.2% | 59.3% |
| Mean | 25.9% | 34.2% |
| Median | 26.6% | 34.8% |
| Interquartile 25% (IQ1) | 18.4% | 24.5% |
| Interquartile 75% (IQ3) | 33.7% | 40.5% |
| Interquartile Range (IQR) | 15.3% | 16.0% |
| Standard Deviation (Sample) | 10.5% | 13.9% |
| Standard Deviation (Population) | 10.4% | 13.8% |
Similar Demographics by Bachelor's Degree
Demographics Similar to Spaniards by Bachelor's Degree
In terms of bachelor's degree, the demographic groups most similar to Spaniards are Immigrants from Middle Africa (36.6%, a difference of 0.090%), Finnish (36.7%, a difference of 0.14%), Immigrants (36.7%, a difference of 0.24%), Immigrants from Nigeria (36.7%, a difference of 0.28%), and Immigrants from Thailand (36.5%, a difference of 0.28%).
| Demographics | Rating | Rank | Bachelor's Degree |
| Immigrants | Costa Rica | 27.4 /100 | #199 | Fair 36.9% |
| Immigrants | Ghana | 27.4 /100 | #200 | Fair 36.9% |
| Immigrants | South Eastern Asia | 25.4 /100 | #201 | Fair 36.8% |
| Immigrants | Zaire | 25.3 /100 | #202 | Fair 36.8% |
| Immigrants | Nigeria | 23.1 /100 | #203 | Fair 36.7% |
| Immigrants | Immigrants | 22.8 /100 | #204 | Fair 36.7% |
| Finns | 22.2 /100 | #205 | Fair 36.7% |
| Spaniards | 21.2 /100 | #206 | Fair 36.6% |
| Immigrants | Middle Africa | 20.6 /100 | #207 | Fair 36.6% |
| Immigrants | Thailand | 19.4 /100 | #208 | Poor 36.5% |
| Panamanians | 18.8 /100 | #209 | Poor 36.5% |
| French | 18.6 /100 | #210 | Poor 36.5% |
| Scotch-Irish | 18.3 /100 | #211 | Poor 36.4% |
| Immigrants | Philippines | 17.8 /100 | #212 | Poor 36.4% |
| Immigrants | Panama | 14.2 /100 | #213 | Poor 36.2% |
Demographics Similar to Costa Ricans by Bachelor's Degree
In terms of bachelor's degree, the demographic groups most similar to Costa Ricans are Basque (37.7%, a difference of 0.020%), Immigrants from Uruguay (37.8%, a difference of 0.080%), Immigrants from Cameroon (37.7%, a difference of 0.080%), Immigrants from Colombia (37.7%, a difference of 0.21%), and Immigrants from Bangladesh (37.8%, a difference of 0.24%).
| Demographics | Rating | Rank | Bachelor's Degree |
| Ghanaians | 55.3 /100 | #169 | Average 38.0% |
| Czechs | 54.4 /100 | #170 | Average 38.0% |
| Bermudans | 54.2 /100 | #171 | Average 38.0% |
| Immigrants | Somalia | 52.8 /100 | #172 | Average 37.9% |
| Immigrants | Iraq | 52.5 /100 | #173 | Average 37.9% |
| Immigrants | Bangladesh | 50.0 /100 | #174 | Average 37.8% |
| Immigrants | Uruguay | 48.3 /100 | #175 | Average 37.8% |
| Costa Ricans | 47.6 /100 | #176 | Average 37.7% |
| Basques | 47.4 /100 | #177 | Average 37.7% |
| Immigrants | Cameroon | 46.8 /100 | #178 | Average 37.7% |
| Immigrants | Colombia | 45.4 /100 | #179 | Average 37.7% |
| Irish | 44.3 /100 | #180 | Average 37.6% |
| Immigrants | Senegal | 43.8 /100 | #181 | Average 37.6% |
| Immigrants | Bosnia and Herzegovina | 43.4 /100 | #182 | Average 37.6% |
| Senegalese | 42.2 /100 | #183 | Average 37.5% |