Scottish vs Immigrants from Poland Bachelor's Degree
COMPARE
Scottish
Immigrants from Poland
Bachelor's Degree
Bachelor's Degree Comparison
Scottish
Immigrants from Poland
38.1%
BACHELOR'S DEGREE
56.6/ 100
METRIC RATING
167th/ 347
METRIC RANK
39.0%
BACHELOR'S DEGREE
77.5/ 100
METRIC RATING
149th/ 347
METRIC RANK
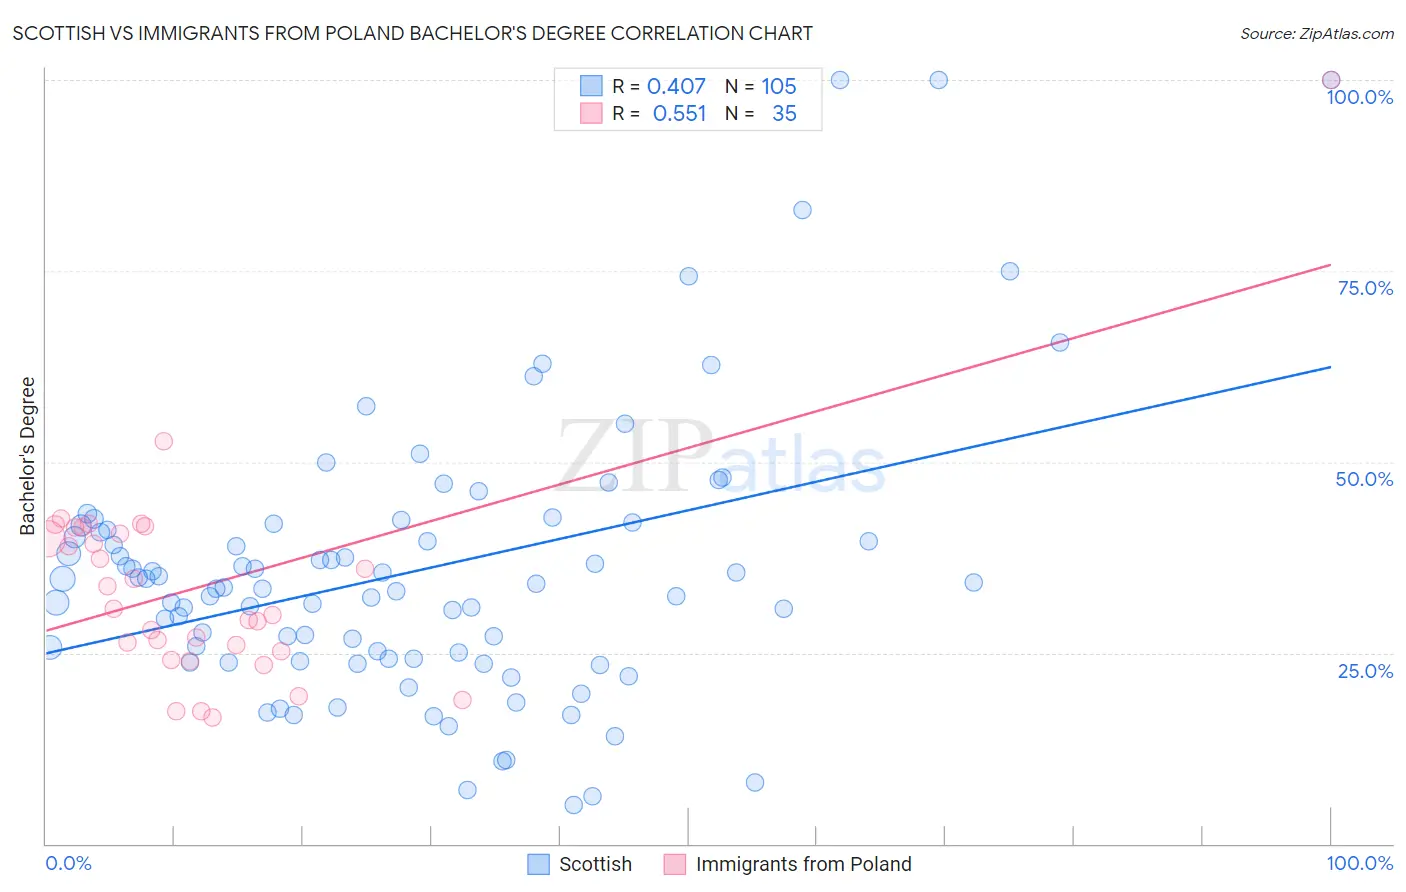
Scottish vs Immigrants from Poland Bachelor's Degree Correlation Chart
The statistical analysis conducted on geographies consisting of 567,001,084 people shows a moderate positive correlation between the proportion of Scottish and percentage of population with at least bachelor's degree education in the United States with a correlation coefficient (R) of 0.407 and weighted average of 38.1%. Similarly, the statistical analysis conducted on geographies consisting of 304,854,598 people shows a substantial positive correlation between the proportion of Immigrants from Poland and percentage of population with at least bachelor's degree education in the United States with a correlation coefficient (R) of 0.551 and weighted average of 39.0%, a difference of 2.4%.
Bachelor's Degree Correlation Summary
| Measurement | Scottish | Immigrants from Poland |
| Minimum | 5.1% | 16.6% |
| Maximum | 100.0% | 100.0% |
| Range | 94.9% | 83.4% |
| Mean | 35.6% | 33.8% |
| Median | 33.5% | 30.8% |
| Interquartile 25% (IQ1) | 24.2% | 25.2% |
| Interquartile 75% (IQ3) | 41.4% | 41.4% |
| Interquartile Range (IQR) | 17.2% | 16.2% |
| Standard Deviation (Sample) | 18.1% | 14.7% |
| Standard Deviation (Population) | 18.0% | 14.5% |
Demographics Similar to Scottish and Immigrants from Poland by Bachelor's Degree
In terms of bachelor's degree, the demographic groups most similar to Scottish are Danish (38.1%, a difference of 0.030%), Somali (38.1%, a difference of 0.21%), Sri Lankan (38.2%, a difference of 0.25%), Hungarian (38.3%, a difference of 0.55%), and Peruvian (38.3%, a difference of 0.69%). Similarly, the demographic groups most similar to Immigrants from Poland are South American (38.9%, a difference of 0.030%), Iraqi (39.0%, a difference of 0.080%), Immigrants from Africa (38.9%, a difference of 0.13%), Sudanese (38.9%, a difference of 0.15%), and Slavic (38.9%, a difference of 0.20%).
| Demographics | Rating | Rank | Bachelor's Degree |
| Iraqis | 78.1 /100 | #148 | Good 39.0% |
| Immigrants | Poland | 77.5 /100 | #149 | Good 39.0% |
| South Americans | 77.3 /100 | #150 | Good 38.9% |
| Immigrants | Africa | 76.5 /100 | #151 | Good 38.9% |
| Sudanese | 76.4 /100 | #152 | Good 38.9% |
| Slavs | 75.9 /100 | #153 | Good 38.9% |
| Canadians | 75.0 /100 | #154 | Good 38.8% |
| Immigrants | Kenya | 73.8 /100 | #155 | Good 38.8% |
| Kenyans | 72.5 /100 | #156 | Good 38.7% |
| Immigrants | South America | 70.1 /100 | #157 | Good 38.6% |
| Immigrants | Germany | 69.6 /100 | #158 | Good 38.6% |
| Chinese | 66.6 /100 | #159 | Good 38.5% |
| Vietnamese | 66.6 /100 | #160 | Good 38.5% |
| Uruguayans | 65.8 /100 | #161 | Good 38.4% |
| Colombians | 65.0 /100 | #162 | Good 38.4% |
| Peruvians | 63.4 /100 | #163 | Good 38.3% |
| Hungarians | 62.1 /100 | #164 | Good 38.3% |
| Sri Lankans | 59.1 /100 | #165 | Average 38.2% |
| Somalis | 58.6 /100 | #166 | Average 38.1% |
| Scottish | 56.6 /100 | #167 | Average 38.1% |
| Danes | 56.2 /100 | #168 | Average 38.1% |