Central American Indian vs Immigrants from Poland Bachelor's Degree
COMPARE
Central American Indian
Immigrants from Poland
Bachelor's Degree
Bachelor's Degree Comparison
Central American Indians
Immigrants from Poland
32.5%
BACHELOR'S DEGREE
0.3/ 100
METRIC RATING
264th/ 347
METRIC RANK
39.0%
BACHELOR'S DEGREE
77.5/ 100
METRIC RATING
149th/ 347
METRIC RANK
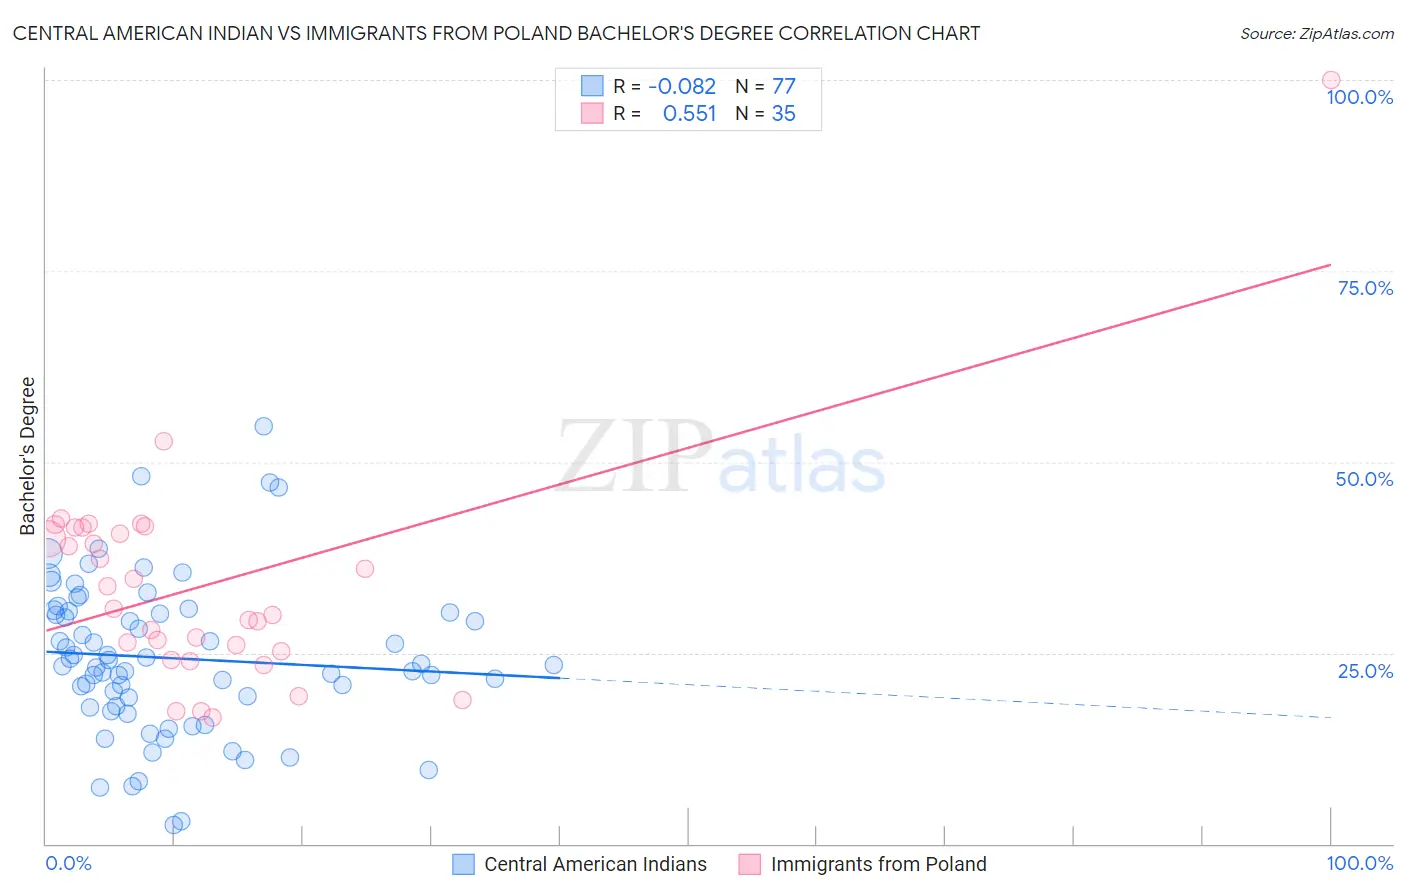
Central American Indian vs Immigrants from Poland Bachelor's Degree Correlation Chart
The statistical analysis conducted on geographies consisting of 326,135,585 people shows a slight negative correlation between the proportion of Central American Indians and percentage of population with at least bachelor's degree education in the United States with a correlation coefficient (R) of -0.082 and weighted average of 32.5%. Similarly, the statistical analysis conducted on geographies consisting of 304,854,598 people shows a substantial positive correlation between the proportion of Immigrants from Poland and percentage of population with at least bachelor's degree education in the United States with a correlation coefficient (R) of 0.551 and weighted average of 39.0%, a difference of 19.7%.
Bachelor's Degree Correlation Summary
| Measurement | Central American Indian | Immigrants from Poland |
| Minimum | 2.5% | 16.6% |
| Maximum | 54.7% | 100.0% |
| Range | 52.2% | 83.4% |
| Mean | 24.3% | 33.8% |
| Median | 23.4% | 30.8% |
| Interquartile 25% (IQ1) | 17.8% | 25.2% |
| Interquartile 75% (IQ3) | 30.3% | 41.4% |
| Interquartile Range (IQR) | 12.5% | 16.2% |
| Standard Deviation (Sample) | 10.1% | 14.7% |
| Standard Deviation (Population) | 10.0% | 14.5% |
Similar Demographics by Bachelor's Degree
Demographics Similar to Central American Indians by Bachelor's Degree
In terms of bachelor's degree, the demographic groups most similar to Central American Indians are Bahamian (32.5%, a difference of 0.030%), Immigrants from Dominica (32.5%, a difference of 0.060%), Cuban (32.5%, a difference of 0.18%), Belizean (32.8%, a difference of 0.78%), and Immigrants from Portugal (32.2%, a difference of 0.94%).
| Demographics | Rating | Rank | Bachelor's Degree |
| Spanish Americans | 0.6 /100 | #257 | Tragic 33.1% |
| French American Indians | 0.6 /100 | #258 | Tragic 33.1% |
| Osage | 0.5 /100 | #259 | Tragic 33.0% |
| Malaysians | 0.5 /100 | #260 | Tragic 32.9% |
| Africans | 0.5 /100 | #261 | Tragic 32.9% |
| Immigrants | Jamaica | 0.5 /100 | #262 | Tragic 32.9% |
| Belizeans | 0.4 /100 | #263 | Tragic 32.8% |
| Central American Indians | 0.3 /100 | #264 | Tragic 32.5% |
| Bahamians | 0.3 /100 | #265 | Tragic 32.5% |
| Immigrants | Dominica | 0.3 /100 | #266 | Tragic 32.5% |
| Cubans | 0.3 /100 | #267 | Tragic 32.5% |
| Immigrants | Portugal | 0.2 /100 | #268 | Tragic 32.2% |
| Immigrants | Belize | 0.2 /100 | #269 | Tragic 32.1% |
| Immigrants | Nicaragua | 0.2 /100 | #270 | Tragic 31.9% |
| Central Americans | 0.2 /100 | #271 | Tragic 31.9% |
Demographics Similar to Immigrants from Poland by Bachelor's Degree
In terms of bachelor's degree, the demographic groups most similar to Immigrants from Poland are South American (38.9%, a difference of 0.030%), Iraqi (39.0%, a difference of 0.080%), Immigrants from Africa (38.9%, a difference of 0.13%), Sudanese (38.9%, a difference of 0.15%), and Slavic (38.9%, a difference of 0.20%).
| Demographics | Rating | Rank | Bachelor's Degree |
| Immigrants | North Macedonia | 81.6 /100 | #142 | Excellent 39.2% |
| Poles | 79.8 /100 | #143 | Good 39.1% |
| Immigrants | Afghanistan | 79.7 /100 | #144 | Good 39.1% |
| Slovenes | 79.5 /100 | #145 | Good 39.1% |
| Swedes | 79.2 /100 | #146 | Good 39.1% |
| Immigrants | Sierra Leone | 79.0 /100 | #147 | Good 39.0% |
| Iraqis | 78.1 /100 | #148 | Good 39.0% |
| Immigrants | Poland | 77.5 /100 | #149 | Good 39.0% |
| South Americans | 77.3 /100 | #150 | Good 38.9% |
| Immigrants | Africa | 76.5 /100 | #151 | Good 38.9% |
| Sudanese | 76.4 /100 | #152 | Good 38.9% |
| Slavs | 75.9 /100 | #153 | Good 38.9% |
| Canadians | 75.0 /100 | #154 | Good 38.8% |
| Immigrants | Kenya | 73.8 /100 | #155 | Good 38.8% |
| Kenyans | 72.5 /100 | #156 | Good 38.7% |