Bermudan vs Immigrants from Poland Bachelor's Degree
COMPARE
Bermudan
Immigrants from Poland
Bachelor's Degree
Bachelor's Degree Comparison
Bermudans
Immigrants from Poland
38.0%
BACHELOR'S DEGREE
54.2/ 100
METRIC RATING
171st/ 347
METRIC RANK
39.0%
BACHELOR'S DEGREE
77.5/ 100
METRIC RATING
149th/ 347
METRIC RANK
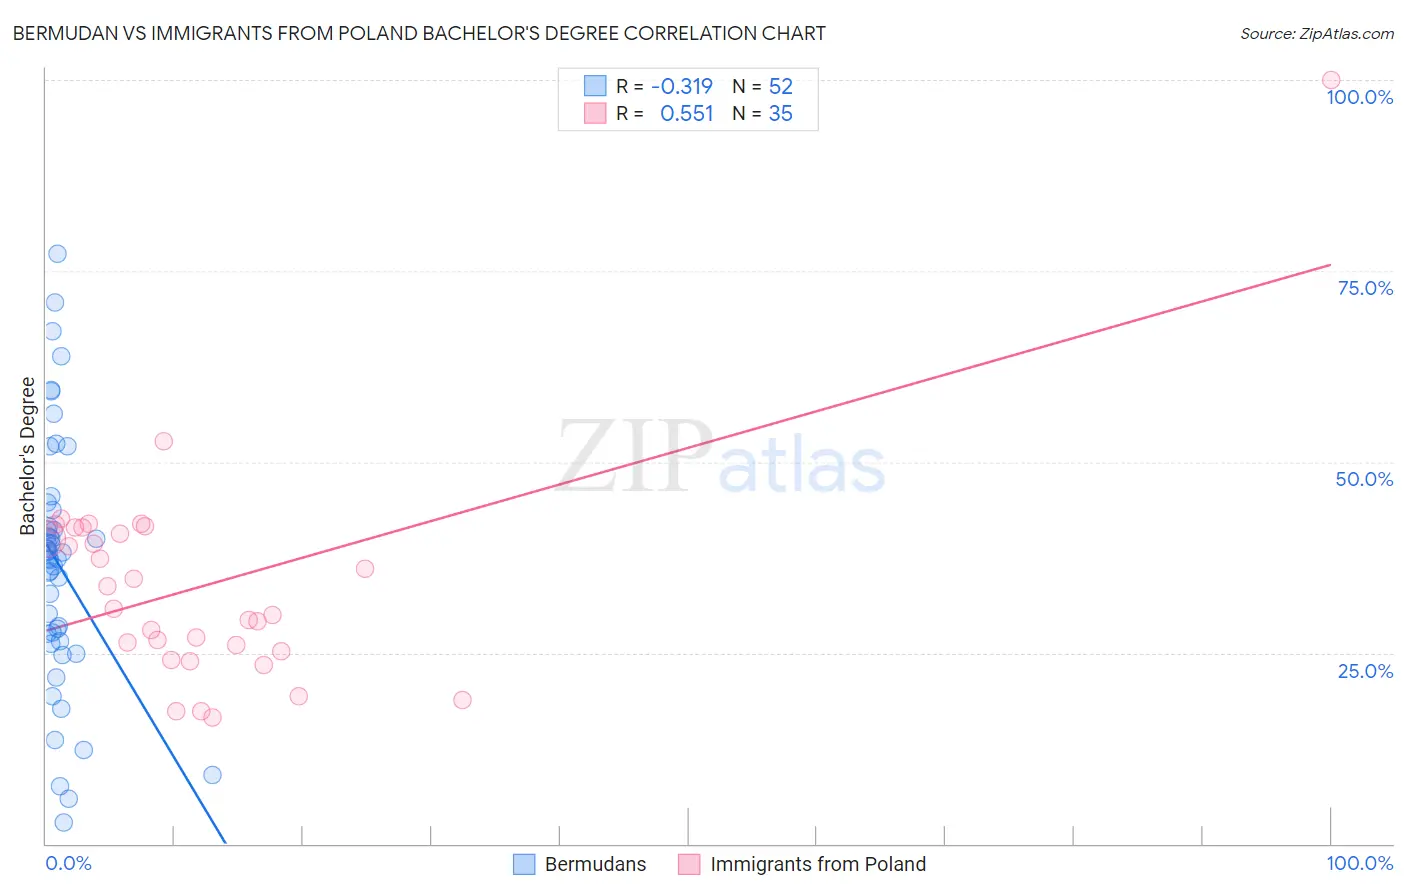
Bermudan vs Immigrants from Poland Bachelor's Degree Correlation Chart
The statistical analysis conducted on geographies consisting of 55,732,325 people shows a mild negative correlation between the proportion of Bermudans and percentage of population with at least bachelor's degree education in the United States with a correlation coefficient (R) of -0.319 and weighted average of 38.0%. Similarly, the statistical analysis conducted on geographies consisting of 304,854,598 people shows a substantial positive correlation between the proportion of Immigrants from Poland and percentage of population with at least bachelor's degree education in the United States with a correlation coefficient (R) of 0.551 and weighted average of 39.0%, a difference of 2.6%.
Bachelor's Degree Correlation Summary
| Measurement | Bermudan | Immigrants from Poland |
| Minimum | 2.7% | 16.6% |
| Maximum | 77.3% | 100.0% |
| Range | 74.5% | 83.4% |
| Mean | 36.6% | 33.8% |
| Median | 37.7% | 30.8% |
| Interquartile 25% (IQ1) | 27.0% | 25.2% |
| Interquartile 75% (IQ3) | 42.7% | 41.4% |
| Interquartile Range (IQR) | 15.7% | 16.2% |
| Standard Deviation (Sample) | 16.3% | 14.7% |
| Standard Deviation (Population) | 16.1% | 14.5% |
Similar Demographics by Bachelor's Degree
Demographics Similar to Bermudans by Bachelor's Degree
In terms of bachelor's degree, the demographic groups most similar to Bermudans are Czech (38.0%, a difference of 0.010%), Ghanaian (38.0%, a difference of 0.11%), Immigrants from Somalia (37.9%, a difference of 0.14%), Immigrants from Iraq (37.9%, a difference of 0.16%), and Danish (38.1%, a difference of 0.20%).
| Demographics | Rating | Rank | Bachelor's Degree |
| Hungarians | 62.1 /100 | #164 | Good 38.3% |
| Sri Lankans | 59.1 /100 | #165 | Average 38.2% |
| Somalis | 58.6 /100 | #166 | Average 38.1% |
| Scottish | 56.6 /100 | #167 | Average 38.1% |
| Danes | 56.2 /100 | #168 | Average 38.1% |
| Ghanaians | 55.3 /100 | #169 | Average 38.0% |
| Czechs | 54.4 /100 | #170 | Average 38.0% |
| Bermudans | 54.2 /100 | #171 | Average 38.0% |
| Immigrants | Somalia | 52.8 /100 | #172 | Average 37.9% |
| Immigrants | Iraq | 52.5 /100 | #173 | Average 37.9% |
| Immigrants | Bangladesh | 50.0 /100 | #174 | Average 37.8% |
| Immigrants | Uruguay | 48.3 /100 | #175 | Average 37.8% |
| Costa Ricans | 47.6 /100 | #176 | Average 37.7% |
| Basques | 47.4 /100 | #177 | Average 37.7% |
| Immigrants | Cameroon | 46.8 /100 | #178 | Average 37.7% |
Demographics Similar to Immigrants from Poland by Bachelor's Degree
In terms of bachelor's degree, the demographic groups most similar to Immigrants from Poland are South American (38.9%, a difference of 0.030%), Iraqi (39.0%, a difference of 0.080%), Immigrants from Africa (38.9%, a difference of 0.13%), Sudanese (38.9%, a difference of 0.15%), and Slavic (38.9%, a difference of 0.20%).
| Demographics | Rating | Rank | Bachelor's Degree |
| Immigrants | North Macedonia | 81.6 /100 | #142 | Excellent 39.2% |
| Poles | 79.8 /100 | #143 | Good 39.1% |
| Immigrants | Afghanistan | 79.7 /100 | #144 | Good 39.1% |
| Slovenes | 79.5 /100 | #145 | Good 39.1% |
| Swedes | 79.2 /100 | #146 | Good 39.1% |
| Immigrants | Sierra Leone | 79.0 /100 | #147 | Good 39.0% |
| Iraqis | 78.1 /100 | #148 | Good 39.0% |
| Immigrants | Poland | 77.5 /100 | #149 | Good 39.0% |
| South Americans | 77.3 /100 | #150 | Good 38.9% |
| Immigrants | Africa | 76.5 /100 | #151 | Good 38.9% |
| Sudanese | 76.4 /100 | #152 | Good 38.9% |
| Slavs | 75.9 /100 | #153 | Good 38.9% |
| Canadians | 75.0 /100 | #154 | Good 38.8% |
| Immigrants | Kenya | 73.8 /100 | #155 | Good 38.8% |
| Kenyans | 72.5 /100 | #156 | Good 38.7% |