Spaniard vs Osage Bachelor's Degree
COMPARE
Spaniard
Osage
Bachelor's Degree
Bachelor's Degree Comparison
Spaniards
Osage
36.6%
BACHELOR'S DEGREE
21.2/ 100
METRIC RATING
206th/ 347
METRIC RANK
33.0%
BACHELOR'S DEGREE
0.5/ 100
METRIC RATING
259th/ 347
METRIC RANK
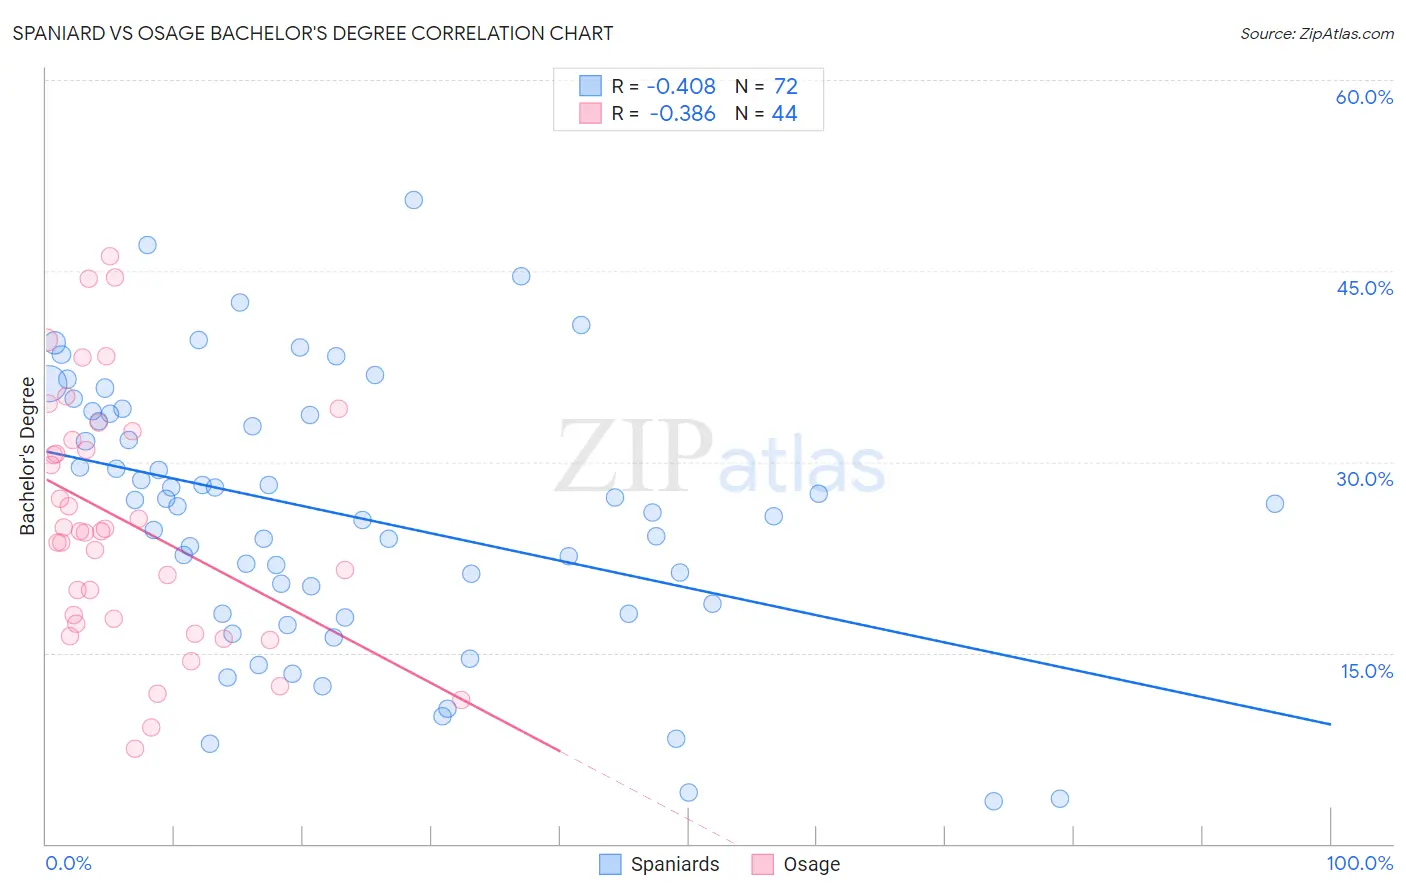
Spaniard vs Osage Bachelor's Degree Correlation Chart
The statistical analysis conducted on geographies consisting of 443,489,635 people shows a moderate negative correlation between the proportion of Spaniards and percentage of population with at least bachelor's degree education in the United States with a correlation coefficient (R) of -0.408 and weighted average of 36.6%. Similarly, the statistical analysis conducted on geographies consisting of 91,806,618 people shows a mild negative correlation between the proportion of Osage and percentage of population with at least bachelor's degree education in the United States with a correlation coefficient (R) of -0.386 and weighted average of 33.0%, a difference of 10.8%.
Bachelor's Degree Correlation Summary
| Measurement | Spaniard | Osage |
| Minimum | 3.3% | 7.5% |
| Maximum | 50.5% | 46.2% |
| Range | 47.2% | 38.7% |
| Mean | 25.9% | 25.3% |
| Median | 26.6% | 24.5% |
| Interquartile 25% (IQ1) | 18.4% | 17.5% |
| Interquartile 75% (IQ3) | 33.7% | 32.0% |
| Interquartile Range (IQR) | 15.3% | 14.6% |
| Standard Deviation (Sample) | 10.5% | 9.7% |
| Standard Deviation (Population) | 10.4% | 9.6% |
Similar Demographics by Bachelor's Degree
Demographics Similar to Spaniards by Bachelor's Degree
In terms of bachelor's degree, the demographic groups most similar to Spaniards are Immigrants from Middle Africa (36.6%, a difference of 0.090%), Finnish (36.7%, a difference of 0.14%), Immigrants (36.7%, a difference of 0.24%), Immigrants from Nigeria (36.7%, a difference of 0.28%), and Immigrants from Thailand (36.5%, a difference of 0.28%).
| Demographics | Rating | Rank | Bachelor's Degree |
| Immigrants | Costa Rica | 27.4 /100 | #199 | Fair 36.9% |
| Immigrants | Ghana | 27.4 /100 | #200 | Fair 36.9% |
| Immigrants | South Eastern Asia | 25.4 /100 | #201 | Fair 36.8% |
| Immigrants | Zaire | 25.3 /100 | #202 | Fair 36.8% |
| Immigrants | Nigeria | 23.1 /100 | #203 | Fair 36.7% |
| Immigrants | Immigrants | 22.8 /100 | #204 | Fair 36.7% |
| Finns | 22.2 /100 | #205 | Fair 36.7% |
| Spaniards | 21.2 /100 | #206 | Fair 36.6% |
| Immigrants | Middle Africa | 20.6 /100 | #207 | Fair 36.6% |
| Immigrants | Thailand | 19.4 /100 | #208 | Poor 36.5% |
| Panamanians | 18.8 /100 | #209 | Poor 36.5% |
| French | 18.6 /100 | #210 | Poor 36.5% |
| Scotch-Irish | 18.3 /100 | #211 | Poor 36.4% |
| Immigrants | Philippines | 17.8 /100 | #212 | Poor 36.4% |
| Immigrants | Panama | 14.2 /100 | #213 | Poor 36.2% |
Demographics Similar to Osage by Bachelor's Degree
In terms of bachelor's degree, the demographic groups most similar to Osage are French American Indian (33.1%, a difference of 0.050%), Spanish American (33.1%, a difference of 0.090%), Nicaraguan (33.1%, a difference of 0.31%), Malaysian (32.9%, a difference of 0.36%), and African (32.9%, a difference of 0.45%).
| Demographics | Rating | Rank | Bachelor's Degree |
| Immigrants | Bahamas | 0.7 /100 | #252 | Tragic 33.3% |
| U.S. Virgin Islanders | 0.7 /100 | #253 | Tragic 33.2% |
| Native Hawaiians | 0.7 /100 | #254 | Tragic 33.2% |
| Iroquois | 0.7 /100 | #255 | Tragic 33.2% |
| Nicaraguans | 0.6 /100 | #256 | Tragic 33.1% |
| Spanish Americans | 0.6 /100 | #257 | Tragic 33.1% |
| French American Indians | 0.6 /100 | #258 | Tragic 33.1% |
| Osage | 0.5 /100 | #259 | Tragic 33.0% |
| Malaysians | 0.5 /100 | #260 | Tragic 32.9% |
| Africans | 0.5 /100 | #261 | Tragic 32.9% |
| Immigrants | Jamaica | 0.5 /100 | #262 | Tragic 32.9% |
| Belizeans | 0.4 /100 | #263 | Tragic 32.8% |
| Central American Indians | 0.3 /100 | #264 | Tragic 32.5% |
| Bahamians | 0.3 /100 | #265 | Tragic 32.5% |
| Immigrants | Dominica | 0.3 /100 | #266 | Tragic 32.5% |