Spaniard vs Immigrants from Poland Median Earnings
COMPARE
Spaniard
Immigrants from Poland
Median Earnings
Median Earnings Comparison
Spaniards
Immigrants from Poland
$46,059
MEDIAN EARNINGS
37.2/ 100
METRIC RATING
189th/ 347
METRIC RANK
$49,633
MEDIAN EARNINGS
98.9/ 100
METRIC RATING
100th/ 347
METRIC RANK
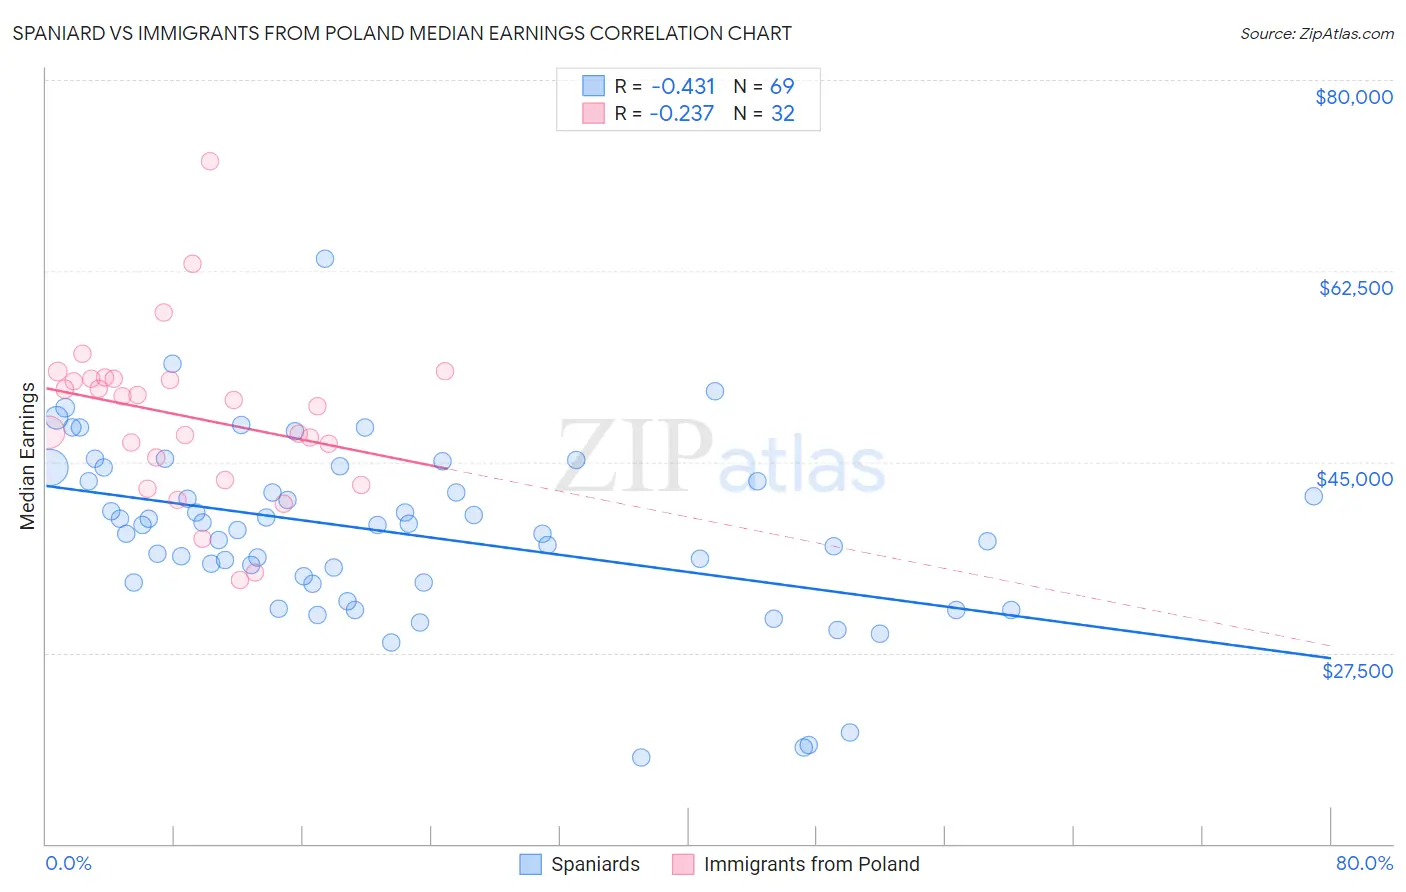
Spaniard vs Immigrants from Poland Median Earnings Correlation Chart
The statistical analysis conducted on geographies consisting of 443,499,083 people shows a moderate negative correlation between the proportion of Spaniards and median earnings in the United States with a correlation coefficient (R) of -0.431 and weighted average of $46,059. Similarly, the statistical analysis conducted on geographies consisting of 304,849,071 people shows a weak negative correlation between the proportion of Immigrants from Poland and median earnings in the United States with a correlation coefficient (R) of -0.237 and weighted average of $49,633, a difference of 7.8%.
Median Earnings Correlation Summary
| Measurement | Spaniard | Immigrants from Poland |
| Minimum | $17,955 | $34,220 |
| Maximum | $63,593 | $72,500 |
| Range | $45,638 | $38,280 |
| Mean | $38,549 | $49,130 |
| Median | $39,160 | $50,398 |
| Interquartile 25% (IQ1) | $33,928 | $44,359 |
| Interquartile 75% (IQ3) | $43,838 | $52,592 |
| Interquartile Range (IQR) | $9,909 | $8,233 |
| Standard Deviation (Sample) | $8,136 | $7,639 |
| Standard Deviation (Population) | $8,076 | $7,518 |
Similar Demographics by Median Earnings
Demographics Similar to Spaniards by Median Earnings
In terms of median earnings, the demographic groups most similar to Spaniards are French Canadian ($46,026, a difference of 0.070%), Immigrants from Armenia ($46,094, a difference of 0.080%), Iraqi ($46,140, a difference of 0.18%), Vietnamese ($46,172, a difference of 0.24%), and Finnish ($45,940, a difference of 0.26%).
| Demographics | Rating | Rank | Median Earnings |
| Swiss | 45.9 /100 | #182 | Average $46,315 |
| French | 45.2 /100 | #183 | Average $46,296 |
| Immigrants | Kenya | 42.4 /100 | #184 | Average $46,214 |
| Uruguayans | 41.6 /100 | #185 | Average $46,190 |
| Vietnamese | 40.9 /100 | #186 | Average $46,172 |
| Iraqis | 39.9 /100 | #187 | Fair $46,140 |
| Immigrants | Armenia | 38.3 /100 | #188 | Fair $46,094 |
| Spaniards | 37.2 /100 | #189 | Fair $46,059 |
| French Canadians | 36.1 /100 | #190 | Fair $46,026 |
| Finns | 33.4 /100 | #191 | Fair $45,940 |
| Germans | 33.2 /100 | #192 | Fair $45,935 |
| Guamanians/Chamorros | 33.2 /100 | #193 | Fair $45,933 |
| Immigrants | Costa Rica | 33.0 /100 | #194 | Fair $45,928 |
| Immigrants | St. Vincent and the Grenadines | 32.4 /100 | #195 | Fair $45,908 |
| Yugoslavians | 30.5 /100 | #196 | Fair $45,846 |
Demographics Similar to Immigrants from Poland by Median Earnings
In terms of median earnings, the demographic groups most similar to Immigrants from Poland are Jordanian ($49,632, a difference of 0.0%), Immigrants from Afghanistan ($49,645, a difference of 0.020%), Immigrants from Northern Africa ($49,648, a difference of 0.030%), Immigrants from North Macedonia ($49,658, a difference of 0.050%), and Immigrants from Lebanon ($49,682, a difference of 0.10%).
| Demographics | Rating | Rank | Median Earnings |
| Armenians | 99.1 /100 | #93 | Exceptional $49,804 |
| Croatians | 99.0 /100 | #94 | Exceptional $49,724 |
| Immigrants | England | 99.0 /100 | #95 | Exceptional $49,722 |
| Immigrants | Lebanon | 99.0 /100 | #96 | Exceptional $49,682 |
| Immigrants | North Macedonia | 98.9 /100 | #97 | Exceptional $49,658 |
| Immigrants | Northern Africa | 98.9 /100 | #98 | Exceptional $49,648 |
| Immigrants | Afghanistan | 98.9 /100 | #99 | Exceptional $49,645 |
| Immigrants | Poland | 98.9 /100 | #100 | Exceptional $49,633 |
| Jordanians | 98.9 /100 | #101 | Exceptional $49,632 |
| Ethiopians | 98.8 /100 | #102 | Exceptional $49,572 |
| Austrians | 98.7 /100 | #103 | Exceptional $49,501 |
| Immigrants | Brazil | 98.6 /100 | #104 | Exceptional $49,463 |
| Immigrants | Western Asia | 98.4 /100 | #105 | Exceptional $49,389 |
| Immigrants | Albania | 98.4 /100 | #106 | Exceptional $49,377 |
| Immigrants | Morocco | 98.4 /100 | #107 | Exceptional $49,368 |