Spaniard vs Immigrants from Costa Rica Bachelor's Degree
COMPARE
Spaniard
Immigrants from Costa Rica
Bachelor's Degree
Bachelor's Degree Comparison
Spaniards
Immigrants from Costa Rica
36.6%
BACHELOR'S DEGREE
21.2/ 100
METRIC RATING
206th/ 347
METRIC RANK
36.9%
BACHELOR'S DEGREE
27.4/ 100
METRIC RATING
199th/ 347
METRIC RANK
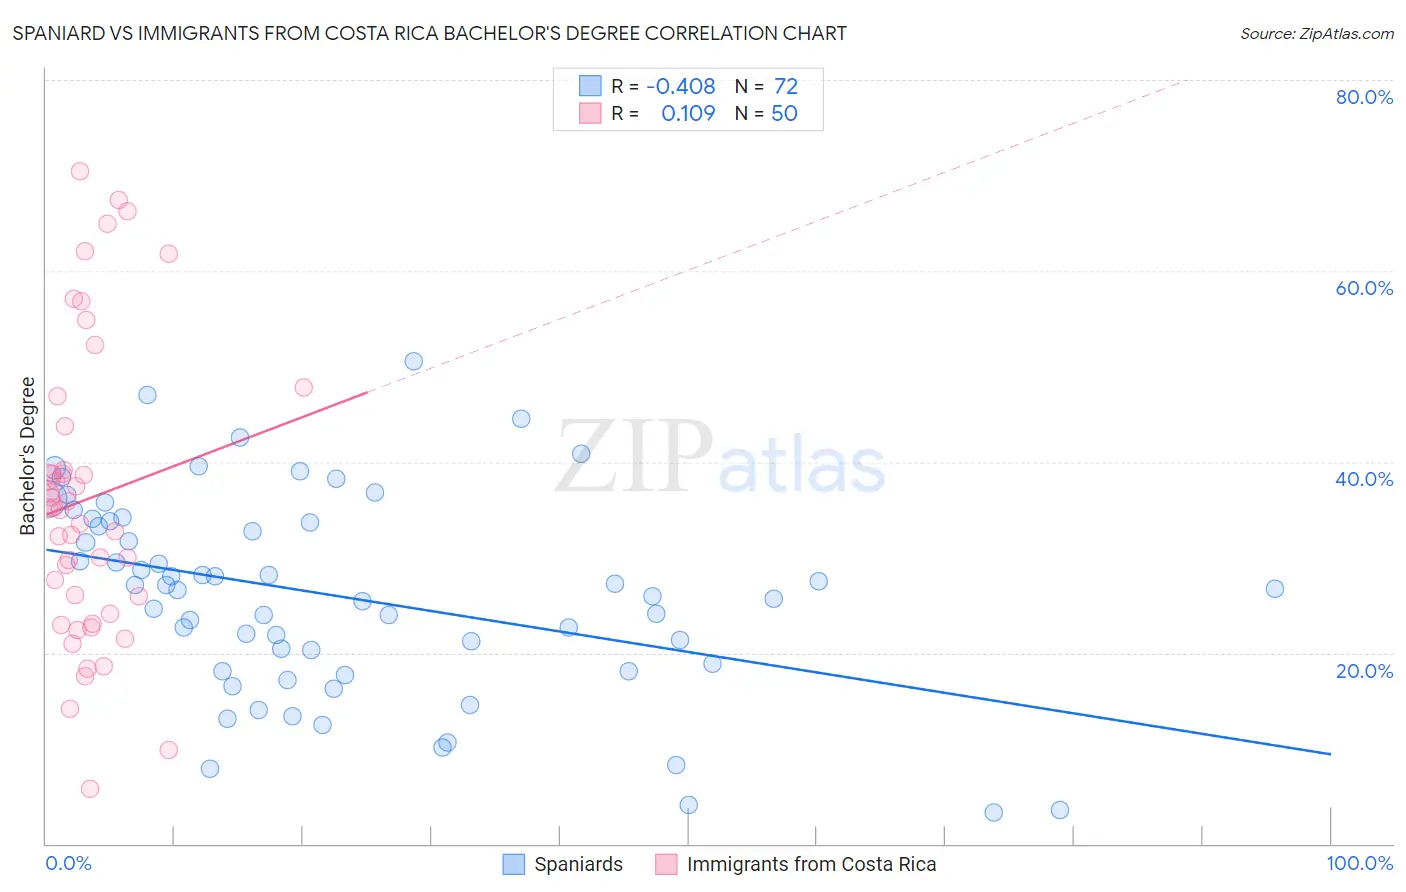
Spaniard vs Immigrants from Costa Rica Bachelor's Degree Correlation Chart
The statistical analysis conducted on geographies consisting of 443,489,635 people shows a moderate negative correlation between the proportion of Spaniards and percentage of population with at least bachelor's degree education in the United States with a correlation coefficient (R) of -0.408 and weighted average of 36.6%. Similarly, the statistical analysis conducted on geographies consisting of 204,273,479 people shows a poor positive correlation between the proportion of Immigrants from Costa Rica and percentage of population with at least bachelor's degree education in the United States with a correlation coefficient (R) of 0.109 and weighted average of 36.9%, a difference of 0.85%.
Bachelor's Degree Correlation Summary
| Measurement | Spaniard | Immigrants from Costa Rica |
| Minimum | 3.3% | 5.7% |
| Maximum | 50.5% | 70.5% |
| Range | 47.2% | 64.7% |
| Mean | 25.9% | 36.1% |
| Median | 26.6% | 35.0% |
| Interquartile 25% (IQ1) | 18.4% | 24.1% |
| Interquartile 75% (IQ3) | 33.7% | 43.8% |
| Interquartile Range (IQR) | 15.3% | 19.7% |
| Standard Deviation (Sample) | 10.5% | 15.6% |
| Standard Deviation (Population) | 10.4% | 15.4% |
Demographics Similar to Spaniards and Immigrants from Costa Rica by Bachelor's Degree
In terms of bachelor's degree, the demographic groups most similar to Spaniards are Immigrants from Middle Africa (36.6%, a difference of 0.090%), Finnish (36.7%, a difference of 0.14%), Immigrants (36.7%, a difference of 0.24%), Immigrants from Nigeria (36.7%, a difference of 0.28%), and Immigrants from Thailand (36.5%, a difference of 0.28%). Similarly, the demographic groups most similar to Immigrants from Costa Rica are Immigrants from Ghana (36.9%, a difference of 0.0%), Welsh (37.0%, a difference of 0.21%), Czechoslovakian (37.0%, a difference of 0.22%), Celtic (37.0%, a difference of 0.26%), and Immigrants from South Eastern Asia (36.8%, a difference of 0.26%).
| Demographics | Rating | Rank | Bachelor's Degree |
| Immigrants | Vietnam | 32.1 /100 | #192 | Fair 37.1% |
| Yugoslavians | 31.5 /100 | #193 | Fair 37.1% |
| Belgians | 29.9 /100 | #194 | Fair 37.0% |
| Koreans | 29.8 /100 | #195 | Fair 37.0% |
| Celtics | 29.5 /100 | #196 | Fair 37.0% |
| Czechoslovakians | 29.2 /100 | #197 | Fair 37.0% |
| Welsh | 29.1 /100 | #198 | Fair 37.0% |
| Immigrants | Costa Rica | 27.4 /100 | #199 | Fair 36.9% |
| Immigrants | Ghana | 27.4 /100 | #200 | Fair 36.9% |
| Immigrants | South Eastern Asia | 25.4 /100 | #201 | Fair 36.8% |
| Immigrants | Zaire | 25.3 /100 | #202 | Fair 36.8% |
| Immigrants | Nigeria | 23.1 /100 | #203 | Fair 36.7% |
| Immigrants | Immigrants | 22.8 /100 | #204 | Fair 36.7% |
| Finns | 22.2 /100 | #205 | Fair 36.7% |
| Spaniards | 21.2 /100 | #206 | Fair 36.6% |
| Immigrants | Middle Africa | 20.6 /100 | #207 | Fair 36.6% |
| Immigrants | Thailand | 19.4 /100 | #208 | Poor 36.5% |
| Panamanians | 18.8 /100 | #209 | Poor 36.5% |
| French | 18.6 /100 | #210 | Poor 36.5% |
| Scotch-Irish | 18.3 /100 | #211 | Poor 36.4% |
| Immigrants | Philippines | 17.8 /100 | #212 | Poor 36.4% |