Slavic vs Cree College, 1 year or more
COMPARE
Slavic
Cree
College, 1 year or more
College, 1 year or more Comparison
Slavs
Cree
60.6%
COLLEGE, 1 YEAR OR MORE
81.1/ 100
METRIC RATING
145th/ 347
METRIC RANK
56.8%
COLLEGE, 1 YEAR OR MORE
3.6/ 100
METRIC RATING
229th/ 347
METRIC RANK
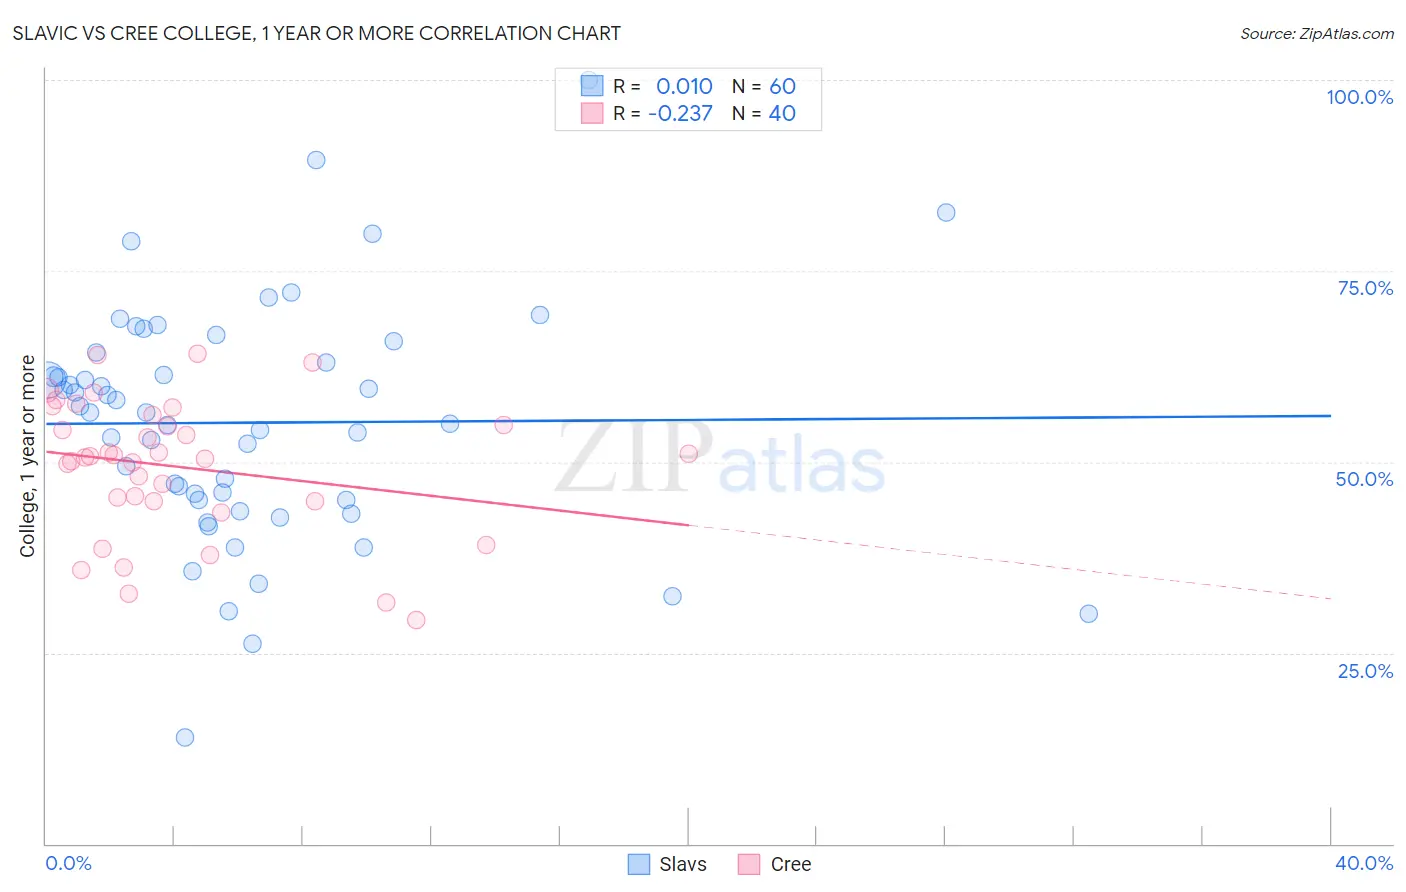
Slavic vs Cree College, 1 year or more Correlation Chart
The statistical analysis conducted on geographies consisting of 270,867,316 people shows no correlation between the proportion of Slavs and percentage of population with at least college, 1 year or more education in the United States with a correlation coefficient (R) of 0.010 and weighted average of 60.6%. Similarly, the statistical analysis conducted on geographies consisting of 76,211,685 people shows a weak negative correlation between the proportion of Cree and percentage of population with at least college, 1 year or more education in the United States with a correlation coefficient (R) of -0.237 and weighted average of 56.8%, a difference of 6.6%.
College, 1 year or more Correlation Summary
| Measurement | Slavic | Cree |
| Minimum | 14.0% | 29.2% |
| Maximum | 100.0% | 64.2% |
| Range | 86.0% | 35.0% |
| Mean | 55.1% | 49.3% |
| Median | 56.5% | 50.6% |
| Interquartile 25% (IQ1) | 45.0% | 44.8% |
| Interquartile 75% (IQ3) | 63.6% | 55.5% |
| Interquartile Range (IQR) | 18.6% | 10.7% |
| Standard Deviation (Sample) | 15.6% | 8.9% |
| Standard Deviation (Population) | 15.4% | 8.8% |
Similar Demographics by College, 1 year or more
Demographics Similar to Slavs by College, 1 year or more
In terms of college, 1 year or more, the demographic groups most similar to Slavs are Czech (60.6%, a difference of 0.070%), Scottish (60.5%, a difference of 0.070%), Canadian (60.6%, a difference of 0.14%), Polish (60.7%, a difference of 0.15%), and Immigrants from Kenya (60.5%, a difference of 0.16%).
| Demographics | Rating | Rank | College, 1 year or more |
| Taiwanese | 84.3 /100 | #138 | Excellent 60.7% |
| Immigrants | Eritrea | 84.3 /100 | #139 | Excellent 60.7% |
| Iraqis | 83.3 /100 | #140 | Excellent 60.7% |
| Immigrants | Afghanistan | 83.1 /100 | #141 | Excellent 60.7% |
| Poles | 82.8 /100 | #142 | Excellent 60.7% |
| Canadians | 82.7 /100 | #143 | Excellent 60.6% |
| Czechs | 81.9 /100 | #144 | Excellent 60.6% |
| Slavs | 81.1 /100 | #145 | Excellent 60.6% |
| Scottish | 80.2 /100 | #146 | Excellent 60.5% |
| Immigrants | Kenya | 79.1 /100 | #147 | Good 60.5% |
| Kenyans | 79.0 /100 | #148 | Good 60.5% |
| Brazilians | 79.0 /100 | #149 | Good 60.5% |
| Immigrants | Sudan | 77.8 /100 | #150 | Good 60.4% |
| Albanians | 77.8 /100 | #151 | Good 60.4% |
| Immigrants | Germany | 76.1 /100 | #152 | Good 60.3% |
Demographics Similar to Cree by College, 1 year or more
In terms of college, 1 year or more, the demographic groups most similar to Cree are Immigrants from Fiji (56.9%, a difference of 0.13%), Liberian (56.7%, a difference of 0.22%), Immigrants (57.0%, a difference of 0.28%), Immigrants from Western Africa (57.0%, a difference of 0.35%), and Vietnamese (57.0%, a difference of 0.37%).
| Demographics | Rating | Rank | College, 1 year or more |
| Sub-Saharan Africans | 6.1 /100 | #222 | Tragic 57.3% |
| Portuguese | 5.4 /100 | #223 | Tragic 57.2% |
| Hmong | 5.4 /100 | #224 | Tragic 57.2% |
| Vietnamese | 4.7 /100 | #225 | Tragic 57.0% |
| Immigrants | Western Africa | 4.6 /100 | #226 | Tragic 57.0% |
| Immigrants | Immigrants | 4.4 /100 | #227 | Tragic 57.0% |
| Immigrants | Fiji | 4.0 /100 | #228 | Tragic 56.9% |
| Cree | 3.6 /100 | #229 | Tragic 56.8% |
| Liberians | 3.1 /100 | #230 | Tragic 56.7% |
| Immigrants | Burma/Myanmar | 2.7 /100 | #231 | Tragic 56.6% |
| Immigrants | Bangladesh | 2.6 /100 | #232 | Tragic 56.6% |
| Immigrants | Nonimmigrants | 2.5 /100 | #233 | Tragic 56.5% |
| Spanish Americans | 1.8 /100 | #234 | Tragic 56.3% |
| West Indians | 1.8 /100 | #235 | Tragic 56.3% |
| Iroquois | 1.7 /100 | #236 | Tragic 56.2% |