Slavic vs Senegalese College, 1 year or more
COMPARE
Slavic
Senegalese
College, 1 year or more
College, 1 year or more Comparison
Slavs
Senegalese
60.6%
COLLEGE, 1 YEAR OR MORE
81.1/ 100
METRIC RATING
145th/ 347
METRIC RANK
58.2%
COLLEGE, 1 YEAR OR MORE
16.9/ 100
METRIC RATING
207th/ 347
METRIC RANK
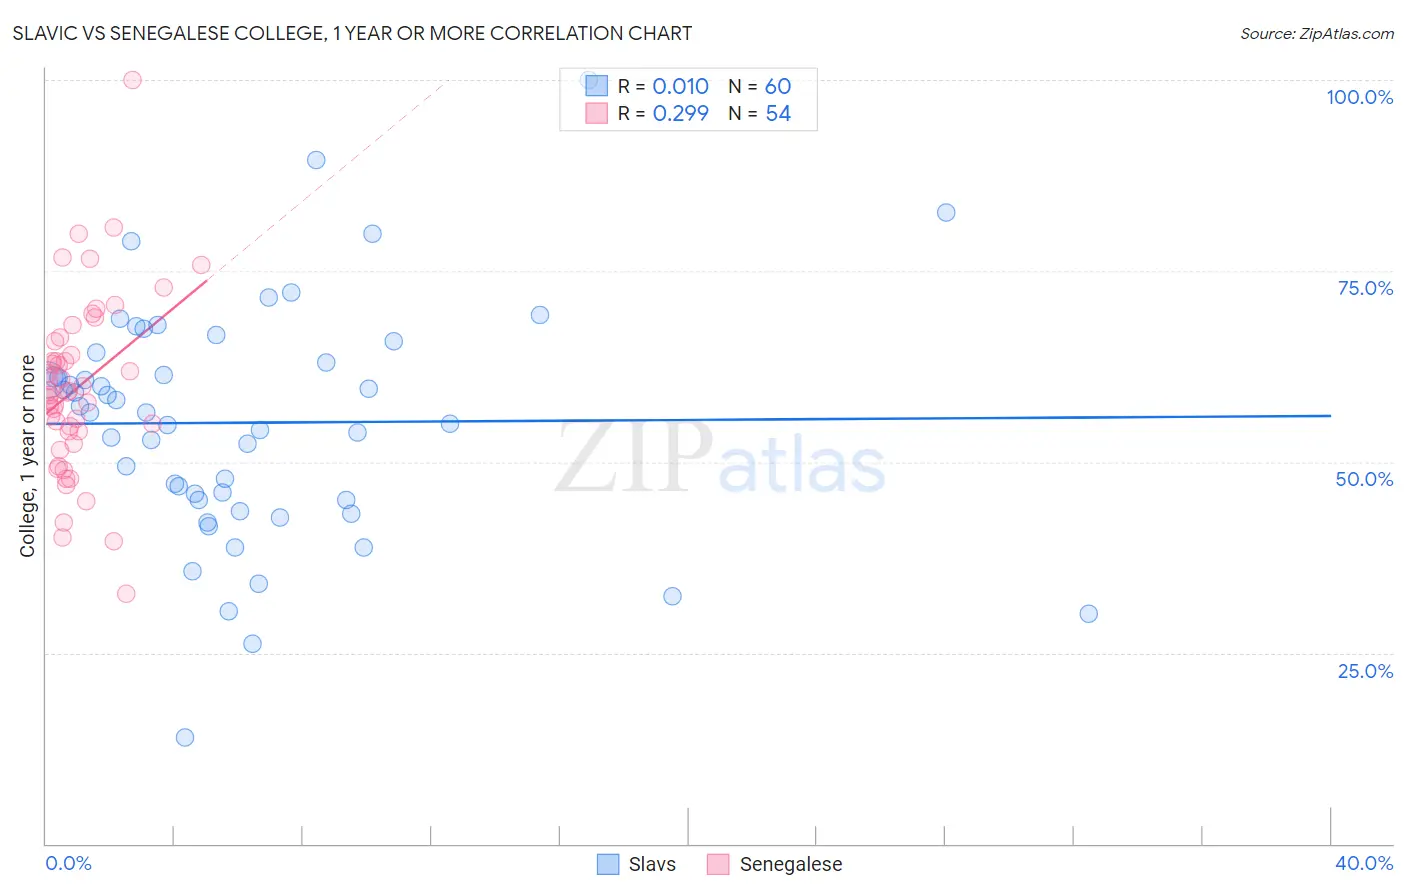
Slavic vs Senegalese College, 1 year or more Correlation Chart
The statistical analysis conducted on geographies consisting of 270,867,316 people shows no correlation between the proportion of Slavs and percentage of population with at least college, 1 year or more education in the United States with a correlation coefficient (R) of 0.010 and weighted average of 60.6%. Similarly, the statistical analysis conducted on geographies consisting of 78,142,569 people shows a weak positive correlation between the proportion of Senegalese and percentage of population with at least college, 1 year or more education in the United States with a correlation coefficient (R) of 0.299 and weighted average of 58.2%, a difference of 4.1%.
College, 1 year or more Correlation Summary
| Measurement | Slavic | Senegalese |
| Minimum | 14.0% | 32.7% |
| Maximum | 100.0% | 100.0% |
| Range | 86.0% | 67.3% |
| Mean | 55.1% | 59.8% |
| Median | 56.5% | 59.2% |
| Interquartile 25% (IQ1) | 45.0% | 54.0% |
| Interquartile 75% (IQ3) | 63.6% | 65.8% |
| Interquartile Range (IQR) | 18.6% | 11.8% |
| Standard Deviation (Sample) | 15.6% | 11.7% |
| Standard Deviation (Population) | 15.4% | 11.6% |
Similar Demographics by College, 1 year or more
Demographics Similar to Slavs by College, 1 year or more
In terms of college, 1 year or more, the demographic groups most similar to Slavs are Czech (60.6%, a difference of 0.070%), Scottish (60.5%, a difference of 0.070%), Canadian (60.6%, a difference of 0.14%), Polish (60.7%, a difference of 0.15%), and Immigrants from Kenya (60.5%, a difference of 0.16%).
| Demographics | Rating | Rank | College, 1 year or more |
| Taiwanese | 84.3 /100 | #138 | Excellent 60.7% |
| Immigrants | Eritrea | 84.3 /100 | #139 | Excellent 60.7% |
| Iraqis | 83.3 /100 | #140 | Excellent 60.7% |
| Immigrants | Afghanistan | 83.1 /100 | #141 | Excellent 60.7% |
| Poles | 82.8 /100 | #142 | Excellent 60.7% |
| Canadians | 82.7 /100 | #143 | Excellent 60.6% |
| Czechs | 81.9 /100 | #144 | Excellent 60.6% |
| Slavs | 81.1 /100 | #145 | Excellent 60.6% |
| Scottish | 80.2 /100 | #146 | Excellent 60.5% |
| Immigrants | Kenya | 79.1 /100 | #147 | Good 60.5% |
| Kenyans | 79.0 /100 | #148 | Good 60.5% |
| Brazilians | 79.0 /100 | #149 | Good 60.5% |
| Immigrants | Sudan | 77.8 /100 | #150 | Good 60.4% |
| Albanians | 77.8 /100 | #151 | Good 60.4% |
| Immigrants | Germany | 76.1 /100 | #152 | Good 60.3% |
Demographics Similar to Senegalese by College, 1 year or more
In terms of college, 1 year or more, the demographic groups most similar to Senegalese are Immigrants from Vietnam (58.2%, a difference of 0.12%), Immigrants from Zaire (58.3%, a difference of 0.16%), Immigrants from Uruguay (58.1%, a difference of 0.17%), Panamanian (58.3%, a difference of 0.21%), and Immigrants from Middle Africa (58.0%, a difference of 0.30%).
| Demographics | Rating | Rank | College, 1 year or more |
| Spanish | 24.2 /100 | #200 | Fair 58.5% |
| Nigerians | 23.0 /100 | #201 | Fair 58.5% |
| Immigrants | South America | 21.9 /100 | #202 | Fair 58.4% |
| Ghanaians | 20.9 /100 | #203 | Fair 58.4% |
| Panamanians | 19.2 /100 | #204 | Poor 58.3% |
| Immigrants | Zaire | 18.7 /100 | #205 | Poor 58.3% |
| Immigrants | Vietnam | 18.2 /100 | #206 | Poor 58.2% |
| Senegalese | 16.9 /100 | #207 | Poor 58.2% |
| Immigrants | Uruguay | 15.2 /100 | #208 | Poor 58.1% |
| Immigrants | Middle Africa | 14.0 /100 | #209 | Poor 58.0% |
| Tsimshian | 13.5 /100 | #210 | Poor 57.9% |
| Immigrants | Nigeria | 13.3 /100 | #211 | Poor 57.9% |
| Immigrants | Senegal | 11.8 /100 | #212 | Poor 57.8% |
| French Canadians | 11.8 /100 | #213 | Poor 57.8% |
| Immigrants | Colombia | 11.6 /100 | #214 | Poor 57.8% |