Native/Alaskan vs Cree College, 1 year or more
COMPARE
Native/Alaskan
Cree
College, 1 year or more
College, 1 year or more Comparison
Natives/Alaskans
Cree
50.2%
COLLEGE, 1 YEAR OR MORE
0.0/ 100
METRIC RATING
330th/ 347
METRIC RANK
56.8%
COLLEGE, 1 YEAR OR MORE
3.6/ 100
METRIC RATING
229th/ 347
METRIC RANK
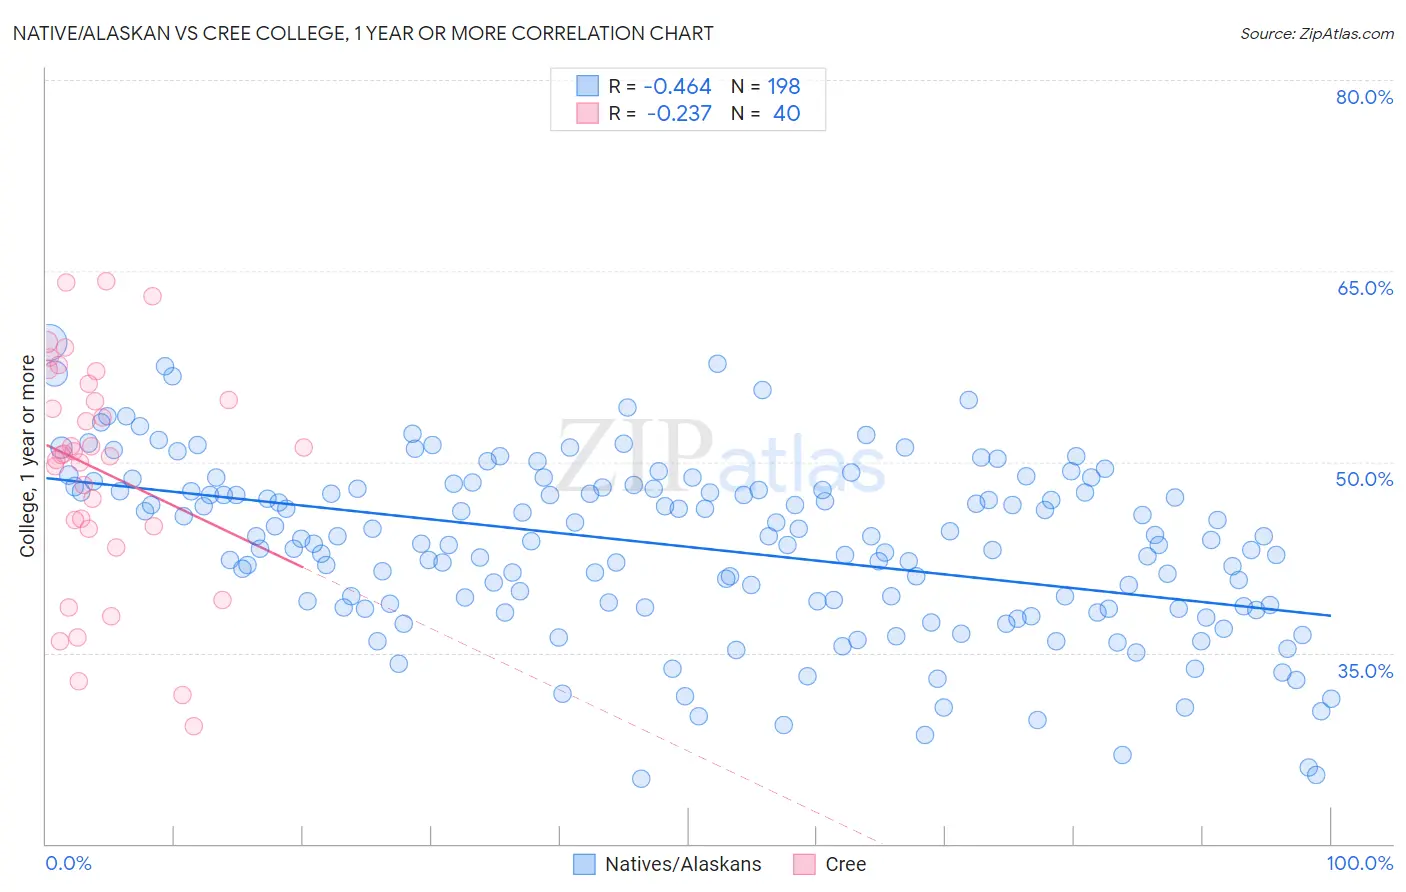
Native/Alaskan vs Cree College, 1 year or more Correlation Chart
The statistical analysis conducted on geographies consisting of 513,066,104 people shows a moderate negative correlation between the proportion of Natives/Alaskans and percentage of population with at least college, 1 year or more education in the United States with a correlation coefficient (R) of -0.464 and weighted average of 50.2%. Similarly, the statistical analysis conducted on geographies consisting of 76,211,685 people shows a weak negative correlation between the proportion of Cree and percentage of population with at least college, 1 year or more education in the United States with a correlation coefficient (R) of -0.237 and weighted average of 56.8%, a difference of 13.2%.
College, 1 year or more Correlation Summary
| Measurement | Native/Alaskan | Cree |
| Minimum | 25.1% | 29.2% |
| Maximum | 59.4% | 64.2% |
| Range | 34.4% | 35.0% |
| Mean | 43.3% | 49.3% |
| Median | 43.9% | 50.6% |
| Interquartile 25% (IQ1) | 38.6% | 44.8% |
| Interquartile 75% (IQ3) | 47.9% | 55.5% |
| Interquartile Range (IQR) | 9.2% | 10.7% |
| Standard Deviation (Sample) | 6.8% | 8.9% |
| Standard Deviation (Population) | 6.8% | 8.8% |
Similar Demographics by College, 1 year or more
Demographics Similar to Natives/Alaskans by College, 1 year or more
In terms of college, 1 year or more, the demographic groups most similar to Natives/Alaskans are Cape Verdean (50.3%, a difference of 0.22%), Immigrants from Yemen (50.0%, a difference of 0.35%), Dutch West Indian (50.5%, a difference of 0.62%), Menominee (50.6%, a difference of 0.74%), and Dominican (50.6%, a difference of 0.77%).
| Demographics | Rating | Rank | College, 1 year or more |
| Immigrants | Guatemala | 0.0 /100 | #323 | Tragic 50.7% |
| Immigrants | Cuba | 0.0 /100 | #324 | Tragic 50.7% |
| Immigrants | Latin America | 0.0 /100 | #325 | Tragic 50.7% |
| Dominicans | 0.0 /100 | #326 | Tragic 50.6% |
| Menominee | 0.0 /100 | #327 | Tragic 50.6% |
| Dutch West Indians | 0.0 /100 | #328 | Tragic 50.5% |
| Cape Verdeans | 0.0 /100 | #329 | Tragic 50.3% |
| Natives/Alaskans | 0.0 /100 | #330 | Tragic 50.2% |
| Immigrants | Yemen | 0.0 /100 | #331 | Tragic 50.0% |
| Mexicans | 0.0 /100 | #332 | Tragic 49.2% |
| Immigrants | Dominican Republic | 0.0 /100 | #333 | Tragic 49.1% |
| Lumbee | 0.0 /100 | #334 | Tragic 48.9% |
| Yuman | 0.0 /100 | #335 | Tragic 48.7% |
| Spanish American Indians | 0.0 /100 | #336 | Tragic 48.5% |
| Pennsylvania Germans | 0.0 /100 | #337 | Tragic 48.5% |
Demographics Similar to Cree by College, 1 year or more
In terms of college, 1 year or more, the demographic groups most similar to Cree are Immigrants from Fiji (56.9%, a difference of 0.13%), Liberian (56.7%, a difference of 0.22%), Immigrants (57.0%, a difference of 0.28%), Immigrants from Western Africa (57.0%, a difference of 0.35%), and Vietnamese (57.0%, a difference of 0.37%).
| Demographics | Rating | Rank | College, 1 year or more |
| Sub-Saharan Africans | 6.1 /100 | #222 | Tragic 57.3% |
| Portuguese | 5.4 /100 | #223 | Tragic 57.2% |
| Hmong | 5.4 /100 | #224 | Tragic 57.2% |
| Vietnamese | 4.7 /100 | #225 | Tragic 57.0% |
| Immigrants | Western Africa | 4.6 /100 | #226 | Tragic 57.0% |
| Immigrants | Immigrants | 4.4 /100 | #227 | Tragic 57.0% |
| Immigrants | Fiji | 4.0 /100 | #228 | Tragic 56.9% |
| Cree | 3.6 /100 | #229 | Tragic 56.8% |
| Liberians | 3.1 /100 | #230 | Tragic 56.7% |
| Immigrants | Burma/Myanmar | 2.7 /100 | #231 | Tragic 56.6% |
| Immigrants | Bangladesh | 2.6 /100 | #232 | Tragic 56.6% |
| Immigrants | Nonimmigrants | 2.5 /100 | #233 | Tragic 56.5% |
| Spanish Americans | 1.8 /100 | #234 | Tragic 56.3% |
| West Indians | 1.8 /100 | #235 | Tragic 56.3% |
| Iroquois | 1.7 /100 | #236 | Tragic 56.2% |