Slavic vs Immigrants from Australia College, 1 year or more
COMPARE
Slavic
Immigrants from Australia
College, 1 year or more
College, 1 year or more Comparison
Slavs
Immigrants from Australia
60.6%
COLLEGE, 1 YEAR OR MORE
81.1/ 100
METRIC RATING
145th/ 347
METRIC RANK
67.7%
COLLEGE, 1 YEAR OR MORE
100.0/ 100
METRIC RATING
10th/ 347
METRIC RANK
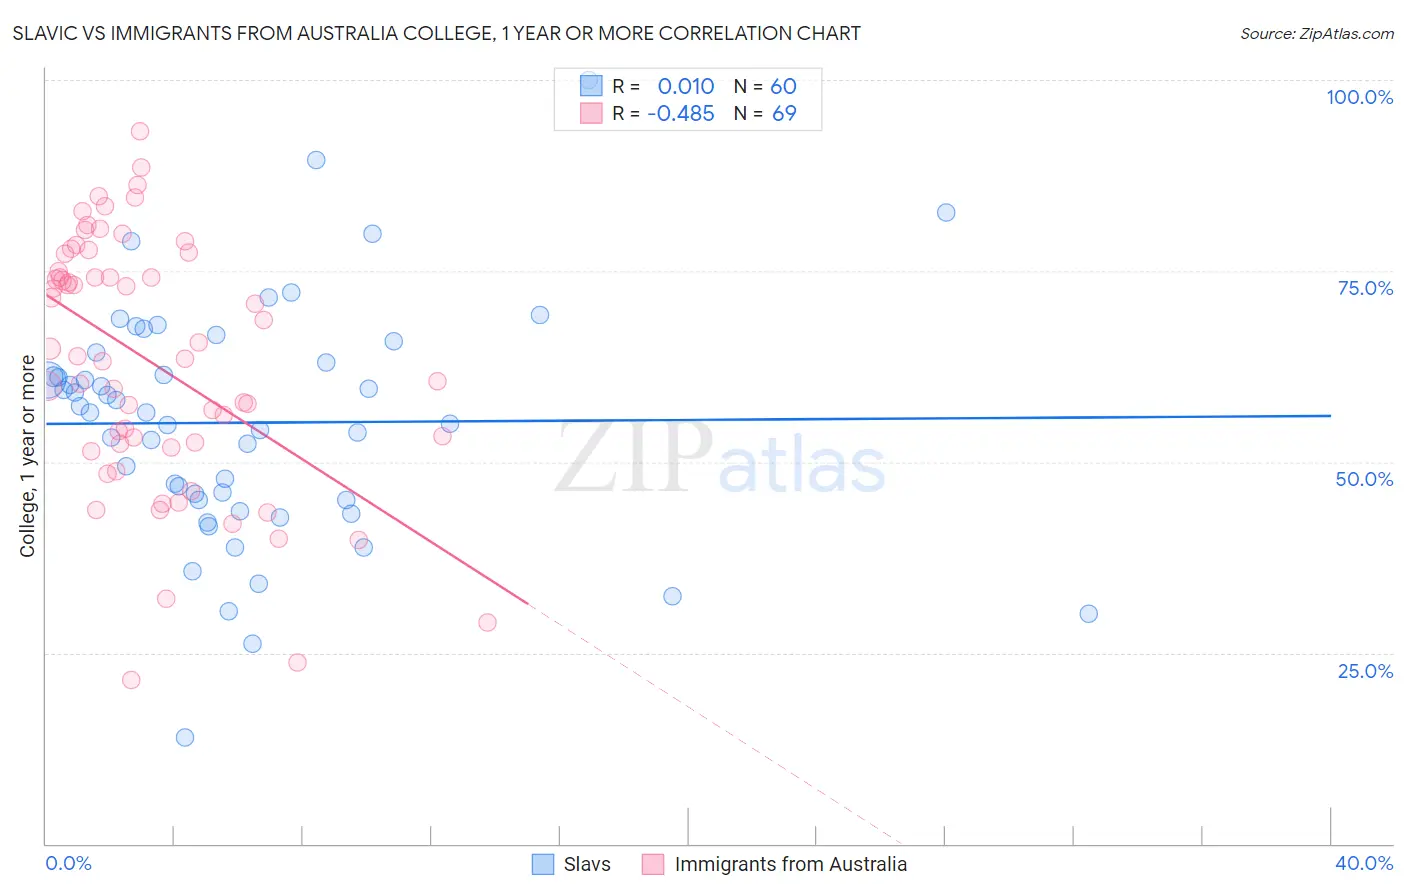
Slavic vs Immigrants from Australia College, 1 year or more Correlation Chart
The statistical analysis conducted on geographies consisting of 270,867,316 people shows no correlation between the proportion of Slavs and percentage of population with at least college, 1 year or more education in the United States with a correlation coefficient (R) of 0.010 and weighted average of 60.6%. Similarly, the statistical analysis conducted on geographies consisting of 227,203,602 people shows a moderate negative correlation between the proportion of Immigrants from Australia and percentage of population with at least college, 1 year or more education in the United States with a correlation coefficient (R) of -0.485 and weighted average of 67.7%, a difference of 11.7%.
College, 1 year or more Correlation Summary
| Measurement | Slavic | Immigrants from Australia |
| Minimum | 14.0% | 21.4% |
| Maximum | 100.0% | 93.2% |
| Range | 86.0% | 71.9% |
| Mean | 55.1% | 63.0% |
| Median | 56.5% | 63.8% |
| Interquartile 25% (IQ1) | 45.0% | 52.1% |
| Interquartile 75% (IQ3) | 63.6% | 76.1% |
| Interquartile Range (IQR) | 18.6% | 24.0% |
| Standard Deviation (Sample) | 15.6% | 16.5% |
| Standard Deviation (Population) | 15.4% | 16.3% |
Similar Demographics by College, 1 year or more
Demographics Similar to Slavs by College, 1 year or more
In terms of college, 1 year or more, the demographic groups most similar to Slavs are Czech (60.6%, a difference of 0.070%), Scottish (60.5%, a difference of 0.070%), Canadian (60.6%, a difference of 0.14%), Polish (60.7%, a difference of 0.15%), and Immigrants from Kenya (60.5%, a difference of 0.16%).
| Demographics | Rating | Rank | College, 1 year or more |
| Taiwanese | 84.3 /100 | #138 | Excellent 60.7% |
| Immigrants | Eritrea | 84.3 /100 | #139 | Excellent 60.7% |
| Iraqis | 83.3 /100 | #140 | Excellent 60.7% |
| Immigrants | Afghanistan | 83.1 /100 | #141 | Excellent 60.7% |
| Poles | 82.8 /100 | #142 | Excellent 60.7% |
| Canadians | 82.7 /100 | #143 | Excellent 60.6% |
| Czechs | 81.9 /100 | #144 | Excellent 60.6% |
| Slavs | 81.1 /100 | #145 | Excellent 60.6% |
| Scottish | 80.2 /100 | #146 | Excellent 60.5% |
| Immigrants | Kenya | 79.1 /100 | #147 | Good 60.5% |
| Kenyans | 79.0 /100 | #148 | Good 60.5% |
| Brazilians | 79.0 /100 | #149 | Good 60.5% |
| Immigrants | Sudan | 77.8 /100 | #150 | Good 60.4% |
| Albanians | 77.8 /100 | #151 | Good 60.4% |
| Immigrants | Germany | 76.1 /100 | #152 | Good 60.3% |
Demographics Similar to Immigrants from Australia by College, 1 year or more
In terms of college, 1 year or more, the demographic groups most similar to Immigrants from Australia are Immigrants from Israel (67.8%, a difference of 0.22%), Immigrants from South Central Asia (67.1%, a difference of 0.77%), Cypriot (67.0%, a difference of 0.94%), Immigrants from Sweden (66.8%, a difference of 1.3%), and Thai (68.6%, a difference of 1.4%).
| Demographics | Rating | Rank | College, 1 year or more |
| Iranians | 100.0 /100 | #3 | Exceptional 70.0% |
| Immigrants | Taiwan | 100.0 /100 | #4 | Exceptional 69.6% |
| Immigrants | India | 100.0 /100 | #5 | Exceptional 69.6% |
| Immigrants | Iran | 100.0 /100 | #6 | Exceptional 69.5% |
| Okinawans | 100.0 /100 | #7 | Exceptional 69.0% |
| Thais | 100.0 /100 | #8 | Exceptional 68.6% |
| Immigrants | Israel | 100.0 /100 | #9 | Exceptional 67.8% |
| Immigrants | Australia | 100.0 /100 | #10 | Exceptional 67.7% |
| Immigrants | South Central Asia | 100.0 /100 | #11 | Exceptional 67.1% |
| Cypriots | 100.0 /100 | #12 | Exceptional 67.0% |
| Immigrants | Sweden | 100.0 /100 | #13 | Exceptional 66.8% |
| Burmese | 100.0 /100 | #14 | Exceptional 66.7% |
| Cambodians | 100.0 /100 | #15 | Exceptional 66.7% |
| Immigrants | Japan | 100.0 /100 | #16 | Exceptional 66.7% |
| Immigrants | Eastern Asia | 100.0 /100 | #17 | Exceptional 66.6% |