Slavic vs Immigrants from Oceania College, 1 year or more
COMPARE
Slavic
Immigrants from Oceania
College, 1 year or more
College, 1 year or more Comparison
Slavs
Immigrants from Oceania
60.6%
COLLEGE, 1 YEAR OR MORE
81.1/ 100
METRIC RATING
145th/ 347
METRIC RANK
59.4%
COLLEGE, 1 YEAR OR MORE
51.2/ 100
METRIC RATING
173rd/ 347
METRIC RANK
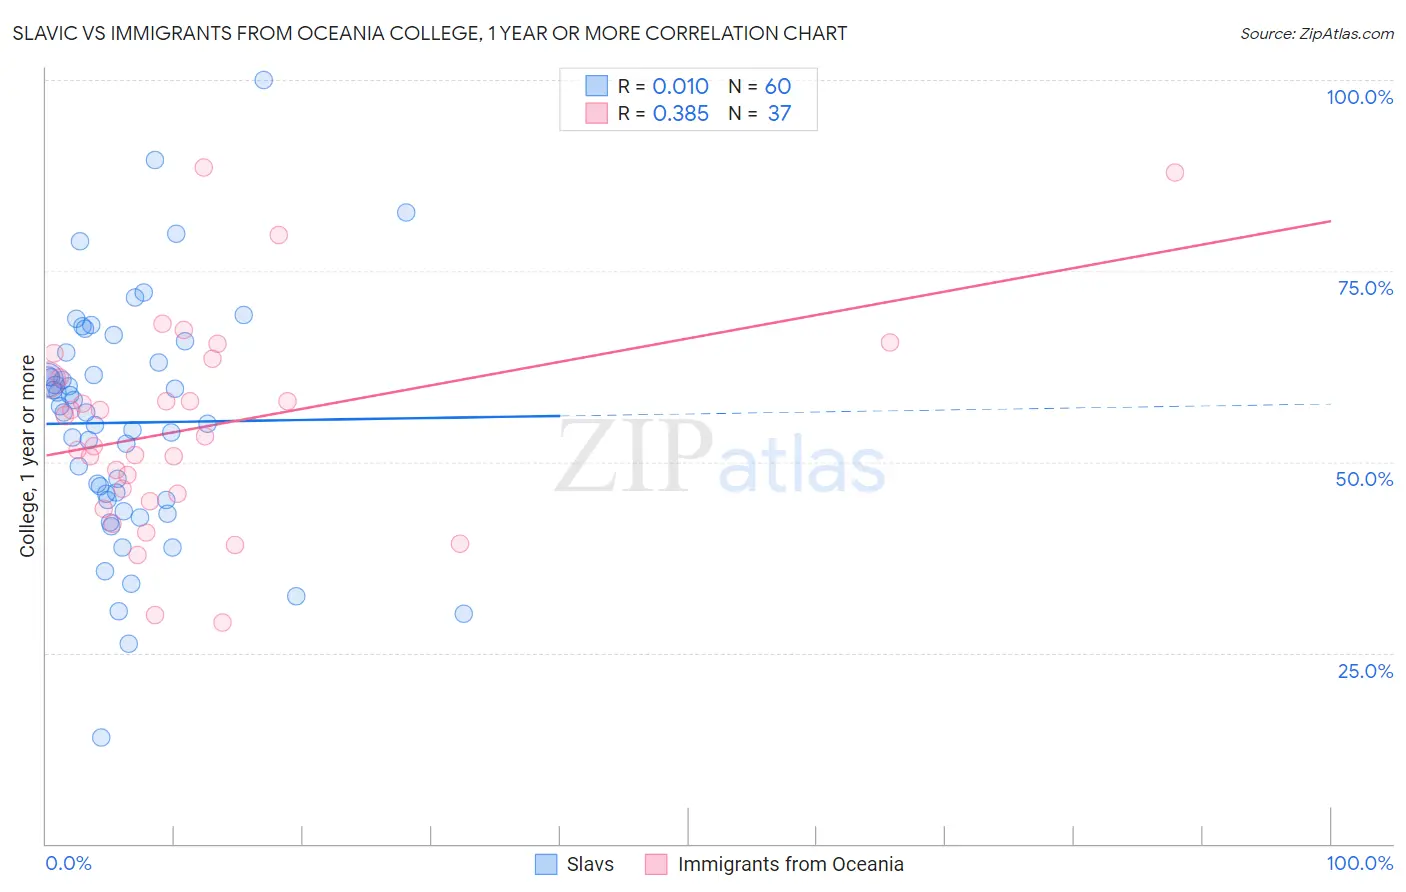
Slavic vs Immigrants from Oceania College, 1 year or more Correlation Chart
The statistical analysis conducted on geographies consisting of 270,867,316 people shows no correlation between the proportion of Slavs and percentage of population with at least college, 1 year or more education in the United States with a correlation coefficient (R) of 0.010 and weighted average of 60.6%. Similarly, the statistical analysis conducted on geographies consisting of 305,519,500 people shows a mild positive correlation between the proportion of Immigrants from Oceania and percentage of population with at least college, 1 year or more education in the United States with a correlation coefficient (R) of 0.385 and weighted average of 59.4%, a difference of 1.9%.
College, 1 year or more Correlation Summary
| Measurement | Slavic | Immigrants from Oceania |
| Minimum | 14.0% | 28.9% |
| Maximum | 100.0% | 88.6% |
| Range | 86.0% | 59.6% |
| Mean | 55.1% | 54.6% |
| Median | 56.5% | 53.4% |
| Interquartile 25% (IQ1) | 45.0% | 45.3% |
| Interquartile 75% (IQ3) | 63.6% | 62.3% |
| Interquartile Range (IQR) | 18.6% | 16.9% |
| Standard Deviation (Sample) | 15.6% | 13.6% |
| Standard Deviation (Population) | 15.4% | 13.4% |
Similar Demographics by College, 1 year or more
Demographics Similar to Slavs by College, 1 year or more
In terms of college, 1 year or more, the demographic groups most similar to Slavs are Czech (60.6%, a difference of 0.070%), Scottish (60.5%, a difference of 0.070%), Canadian (60.6%, a difference of 0.14%), Polish (60.7%, a difference of 0.15%), and Immigrants from Kenya (60.5%, a difference of 0.16%).
| Demographics | Rating | Rank | College, 1 year or more |
| Taiwanese | 84.3 /100 | #138 | Excellent 60.7% |
| Immigrants | Eritrea | 84.3 /100 | #139 | Excellent 60.7% |
| Iraqis | 83.3 /100 | #140 | Excellent 60.7% |
| Immigrants | Afghanistan | 83.1 /100 | #141 | Excellent 60.7% |
| Poles | 82.8 /100 | #142 | Excellent 60.7% |
| Canadians | 82.7 /100 | #143 | Excellent 60.6% |
| Czechs | 81.9 /100 | #144 | Excellent 60.6% |
| Slavs | 81.1 /100 | #145 | Excellent 60.6% |
| Scottish | 80.2 /100 | #146 | Excellent 60.5% |
| Immigrants | Kenya | 79.1 /100 | #147 | Good 60.5% |
| Kenyans | 79.0 /100 | #148 | Good 60.5% |
| Brazilians | 79.0 /100 | #149 | Good 60.5% |
| Immigrants | Sudan | 77.8 /100 | #150 | Good 60.4% |
| Albanians | 77.8 /100 | #151 | Good 60.4% |
| Immigrants | Germany | 76.1 /100 | #152 | Good 60.3% |
Demographics Similar to Immigrants from Oceania by College, 1 year or more
In terms of college, 1 year or more, the demographic groups most similar to Immigrants from Oceania are Immigrants from Sierra Leone (59.5%, a difference of 0.050%), Welsh (59.5%, a difference of 0.060%), Immigrants from Albania (59.5%, a difference of 0.060%), Celtic (59.4%, a difference of 0.060%), and Immigrants from Southern Europe (59.5%, a difference of 0.080%).
| Demographics | Rating | Rank | College, 1 year or more |
| Immigrants | Africa | 56.1 /100 | #166 | Average 59.6% |
| Immigrants | North Macedonia | 53.1 /100 | #167 | Average 59.5% |
| Hungarians | 52.9 /100 | #168 | Average 59.5% |
| Immigrants | Southern Europe | 52.7 /100 | #169 | Average 59.5% |
| Welsh | 52.4 /100 | #170 | Average 59.5% |
| Immigrants | Albania | 52.3 /100 | #171 | Average 59.5% |
| Immigrants | Sierra Leone | 52.2 /100 | #172 | Average 59.5% |
| Immigrants | Oceania | 51.2 /100 | #173 | Average 59.4% |
| Celtics | 50.0 /100 | #174 | Average 59.4% |
| Sri Lankans | 49.0 /100 | #175 | Average 59.4% |
| Immigrants | Poland | 48.9 /100 | #176 | Average 59.4% |
| Tlingit-Haida | 48.4 /100 | #177 | Average 59.4% |
| Czechoslovakians | 48.3 /100 | #178 | Average 59.4% |
| Bermudans | 46.6 /100 | #179 | Average 59.3% |
| Yugoslavians | 44.1 /100 | #180 | Average 59.2% |