Jamaican vs Cree College, 1 year or more
COMPARE
Jamaican
Cree
College, 1 year or more
College, 1 year or more Comparison
Jamaicans
Cree
54.9%
COLLEGE, 1 YEAR OR MORE
0.3/ 100
METRIC RATING
260th/ 347
METRIC RANK
56.8%
COLLEGE, 1 YEAR OR MORE
3.6/ 100
METRIC RATING
229th/ 347
METRIC RANK
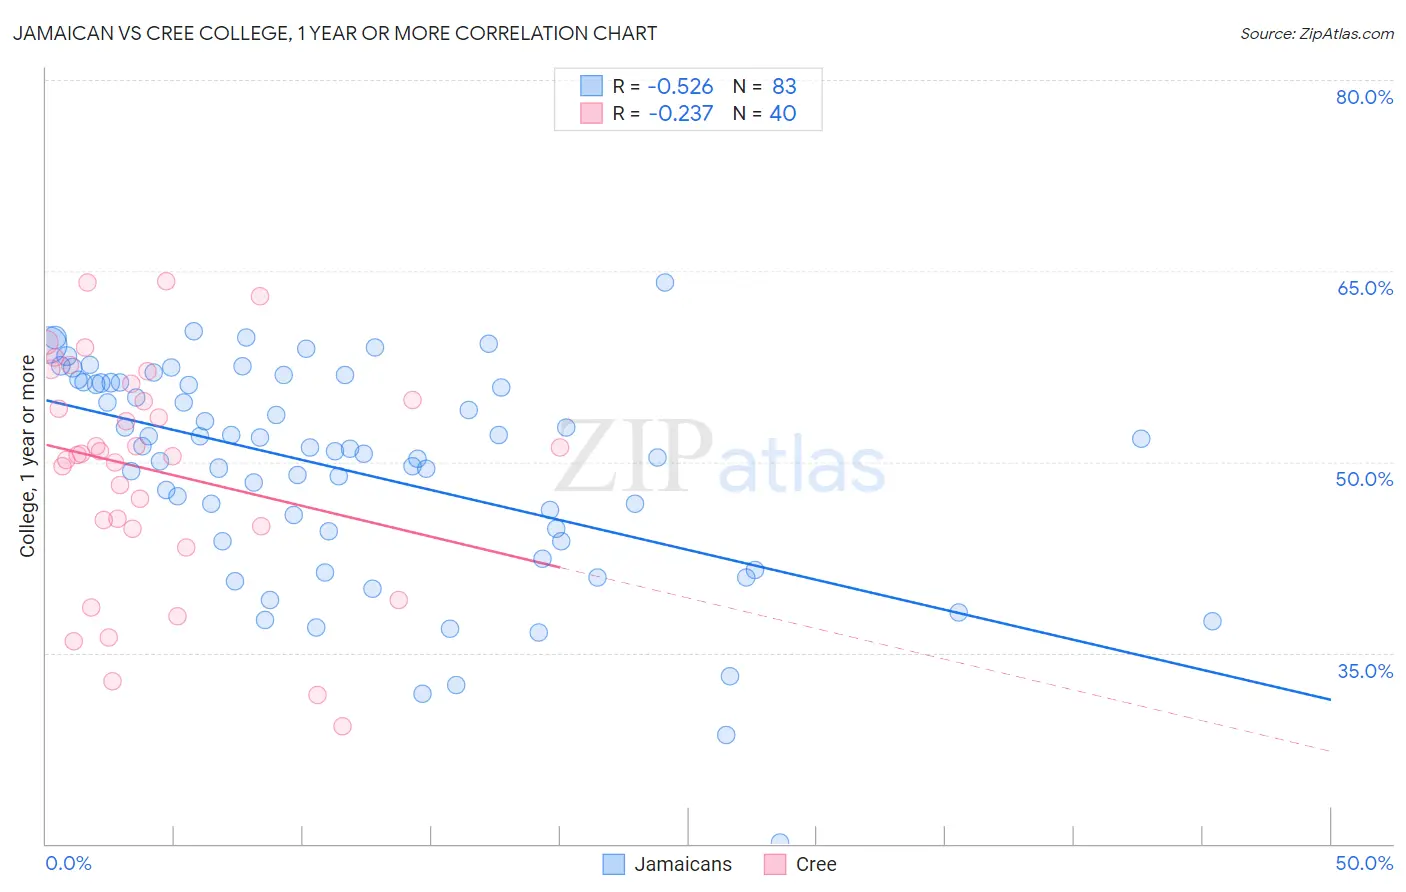
Jamaican vs Cree College, 1 year or more Correlation Chart
The statistical analysis conducted on geographies consisting of 368,077,485 people shows a substantial negative correlation between the proportion of Jamaicans and percentage of population with at least college, 1 year or more education in the United States with a correlation coefficient (R) of -0.526 and weighted average of 54.9%. Similarly, the statistical analysis conducted on geographies consisting of 76,211,685 people shows a weak negative correlation between the proportion of Cree and percentage of population with at least college, 1 year or more education in the United States with a correlation coefficient (R) of -0.237 and weighted average of 56.8%, a difference of 3.6%.
College, 1 year or more Correlation Summary
| Measurement | Jamaican | Cree |
| Minimum | 20.1% | 29.2% |
| Maximum | 64.1% | 64.2% |
| Range | 44.0% | 35.0% |
| Mean | 49.3% | 49.3% |
| Median | 51.0% | 50.6% |
| Interquartile 25% (IQ1) | 43.8% | 44.8% |
| Interquartile 75% (IQ3) | 56.2% | 55.5% |
| Interquartile Range (IQR) | 12.4% | 10.7% |
| Standard Deviation (Sample) | 8.5% | 8.9% |
| Standard Deviation (Population) | 8.4% | 8.8% |
Similar Demographics by College, 1 year or more
Demographics Similar to Jamaicans by College, 1 year or more
In terms of college, 1 year or more, the demographic groups most similar to Jamaicans are Ottawa (54.9%, a difference of 0.030%), Nepalese (54.9%, a difference of 0.10%), Immigrants from St. Vincent and the Grenadines (54.8%, a difference of 0.11%), U.S. Virgin Islander (54.8%, a difference of 0.13%), and African (55.0%, a difference of 0.16%).
| Demographics | Rating | Rank | College, 1 year or more |
| Immigrants | Barbados | 0.6 /100 | #253 | Tragic 55.4% |
| Japanese | 0.5 /100 | #254 | Tragic 55.2% |
| Immigrants | Bahamas | 0.5 /100 | #255 | Tragic 55.2% |
| Immigrants | West Indies | 0.5 /100 | #256 | Tragic 55.2% |
| Indonesians | 0.4 /100 | #257 | Tragic 55.1% |
| Africans | 0.4 /100 | #258 | Tragic 55.0% |
| Nepalese | 0.3 /100 | #259 | Tragic 54.9% |
| Jamaicans | 0.3 /100 | #260 | Tragic 54.9% |
| Ottawa | 0.3 /100 | #261 | Tragic 54.9% |
| Immigrants | St. Vincent and the Grenadines | 0.3 /100 | #262 | Tragic 54.8% |
| U.S. Virgin Islanders | 0.3 /100 | #263 | Tragic 54.8% |
| Immigrants | Micronesia | 0.3 /100 | #264 | Tragic 54.8% |
| Immigrants | Laos | 0.2 /100 | #265 | Tragic 54.7% |
| Potawatomi | 0.2 /100 | #266 | Tragic 54.6% |
| Blackfeet | 0.2 /100 | #267 | Tragic 54.6% |
Demographics Similar to Cree by College, 1 year or more
In terms of college, 1 year or more, the demographic groups most similar to Cree are Immigrants from Fiji (56.9%, a difference of 0.13%), Liberian (56.7%, a difference of 0.22%), Immigrants (57.0%, a difference of 0.28%), Immigrants from Western Africa (57.0%, a difference of 0.35%), and Vietnamese (57.0%, a difference of 0.37%).
| Demographics | Rating | Rank | College, 1 year or more |
| Sub-Saharan Africans | 6.1 /100 | #222 | Tragic 57.3% |
| Portuguese | 5.4 /100 | #223 | Tragic 57.2% |
| Hmong | 5.4 /100 | #224 | Tragic 57.2% |
| Vietnamese | 4.7 /100 | #225 | Tragic 57.0% |
| Immigrants | Western Africa | 4.6 /100 | #226 | Tragic 57.0% |
| Immigrants | Immigrants | 4.4 /100 | #227 | Tragic 57.0% |
| Immigrants | Fiji | 4.0 /100 | #228 | Tragic 56.9% |
| Cree | 3.6 /100 | #229 | Tragic 56.8% |
| Liberians | 3.1 /100 | #230 | Tragic 56.7% |
| Immigrants | Burma/Myanmar | 2.7 /100 | #231 | Tragic 56.6% |
| Immigrants | Bangladesh | 2.6 /100 | #232 | Tragic 56.6% |
| Immigrants | Nonimmigrants | 2.5 /100 | #233 | Tragic 56.5% |
| Spanish Americans | 1.8 /100 | #234 | Tragic 56.3% |
| West Indians | 1.8 /100 | #235 | Tragic 56.3% |
| Iroquois | 1.7 /100 | #236 | Tragic 56.2% |