Swiss vs Cree College, 1 year or more
COMPARE
Swiss
Cree
College, 1 year or more
College, 1 year or more Comparison
Swiss
Cree
59.2%
COLLEGE, 1 YEAR OR MORE
43.4/ 100
METRIC RATING
181st/ 347
METRIC RANK
56.8%
COLLEGE, 1 YEAR OR MORE
3.6/ 100
METRIC RATING
229th/ 347
METRIC RANK
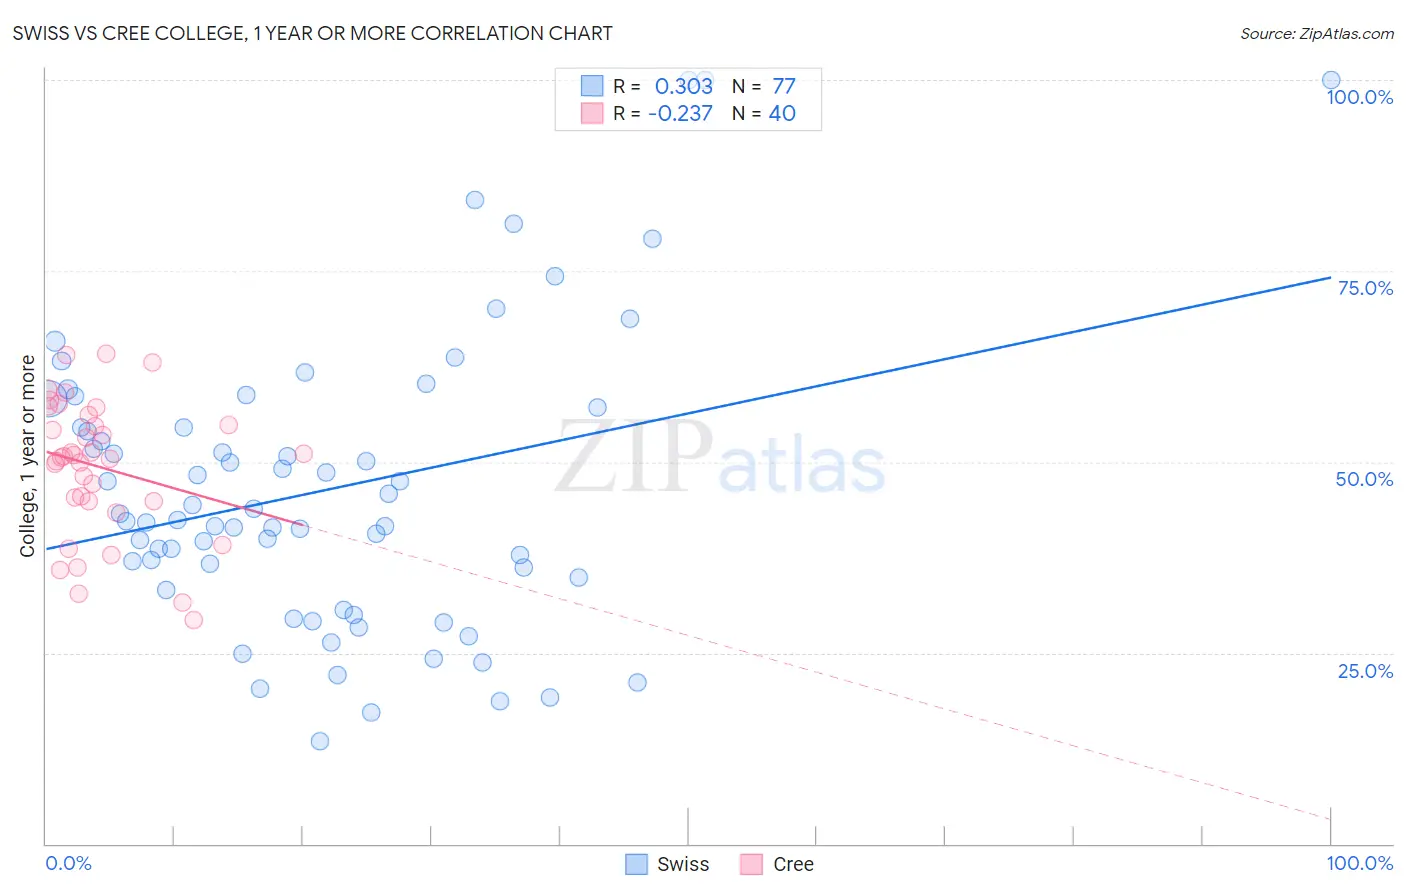
Swiss vs Cree College, 1 year or more Correlation Chart
The statistical analysis conducted on geographies consisting of 465,017,348 people shows a mild positive correlation between the proportion of Swiss and percentage of population with at least college, 1 year or more education in the United States with a correlation coefficient (R) of 0.303 and weighted average of 59.2%. Similarly, the statistical analysis conducted on geographies consisting of 76,211,685 people shows a weak negative correlation between the proportion of Cree and percentage of population with at least college, 1 year or more education in the United States with a correlation coefficient (R) of -0.237 and weighted average of 56.8%, a difference of 4.2%.
College, 1 year or more Correlation Summary
| Measurement | Swiss | Cree |
| Minimum | 13.4% | 29.2% |
| Maximum | 100.0% | 64.2% |
| Range | 86.6% | 35.0% |
| Mean | 46.3% | 49.3% |
| Median | 42.4% | 50.6% |
| Interquartile 25% (IQ1) | 34.1% | 44.8% |
| Interquartile 75% (IQ3) | 55.8% | 55.5% |
| Interquartile Range (IQR) | 21.7% | 10.7% |
| Standard Deviation (Sample) | 18.9% | 8.9% |
| Standard Deviation (Population) | 18.8% | 8.8% |
Similar Demographics by College, 1 year or more
Demographics Similar to Swiss by College, 1 year or more
In terms of college, 1 year or more, the demographic groups most similar to Swiss are Immigrants from Bosnia and Herzegovina (59.2%, a difference of 0.030%), Yugoslavian (59.2%, a difference of 0.040%), Bermudan (59.3%, a difference of 0.17%), German Russian (59.1%, a difference of 0.22%), and Tlingit-Haida (59.4%, a difference of 0.27%).
| Demographics | Rating | Rank | College, 1 year or more |
| Celtics | 50.0 /100 | #174 | Average 59.4% |
| Sri Lankans | 49.0 /100 | #175 | Average 59.4% |
| Immigrants | Poland | 48.9 /100 | #176 | Average 59.4% |
| Tlingit-Haida | 48.4 /100 | #177 | Average 59.4% |
| Czechoslovakians | 48.3 /100 | #178 | Average 59.4% |
| Bermudans | 46.6 /100 | #179 | Average 59.3% |
| Yugoslavians | 44.1 /100 | #180 | Average 59.2% |
| Swiss | 43.4 /100 | #181 | Average 59.2% |
| Immigrants | Bosnia and Herzegovina | 42.8 /100 | #182 | Average 59.2% |
| German Russians | 39.3 /100 | #183 | Fair 59.1% |
| Spaniards | 38.3 /100 | #184 | Fair 59.0% |
| South Americans | 35.9 /100 | #185 | Fair 59.0% |
| Scotch-Irish | 34.7 /100 | #186 | Fair 58.9% |
| Germans | 34.7 /100 | #187 | Fair 58.9% |
| French | 34.4 /100 | #188 | Fair 58.9% |
Demographics Similar to Cree by College, 1 year or more
In terms of college, 1 year or more, the demographic groups most similar to Cree are Immigrants from Fiji (56.9%, a difference of 0.13%), Liberian (56.7%, a difference of 0.22%), Immigrants (57.0%, a difference of 0.28%), Immigrants from Western Africa (57.0%, a difference of 0.35%), and Vietnamese (57.0%, a difference of 0.37%).
| Demographics | Rating | Rank | College, 1 year or more |
| Sub-Saharan Africans | 6.1 /100 | #222 | Tragic 57.3% |
| Portuguese | 5.4 /100 | #223 | Tragic 57.2% |
| Hmong | 5.4 /100 | #224 | Tragic 57.2% |
| Vietnamese | 4.7 /100 | #225 | Tragic 57.0% |
| Immigrants | Western Africa | 4.6 /100 | #226 | Tragic 57.0% |
| Immigrants | Immigrants | 4.4 /100 | #227 | Tragic 57.0% |
| Immigrants | Fiji | 4.0 /100 | #228 | Tragic 56.9% |
| Cree | 3.6 /100 | #229 | Tragic 56.8% |
| Liberians | 3.1 /100 | #230 | Tragic 56.7% |
| Immigrants | Burma/Myanmar | 2.7 /100 | #231 | Tragic 56.6% |
| Immigrants | Bangladesh | 2.6 /100 | #232 | Tragic 56.6% |
| Immigrants | Nonimmigrants | 2.5 /100 | #233 | Tragic 56.5% |
| Spanish Americans | 1.8 /100 | #234 | Tragic 56.3% |
| West Indians | 1.8 /100 | #235 | Tragic 56.3% |
| Iroquois | 1.7 /100 | #236 | Tragic 56.2% |