Slavic vs South American College, 1 year or more
COMPARE
Slavic
South American
College, 1 year or more
College, 1 year or more Comparison
Slavs
South Americans
60.6%
COLLEGE, 1 YEAR OR MORE
81.1/ 100
METRIC RATING
145th/ 347
METRIC RANK
59.0%
COLLEGE, 1 YEAR OR MORE
35.9/ 100
METRIC RATING
185th/ 347
METRIC RANK
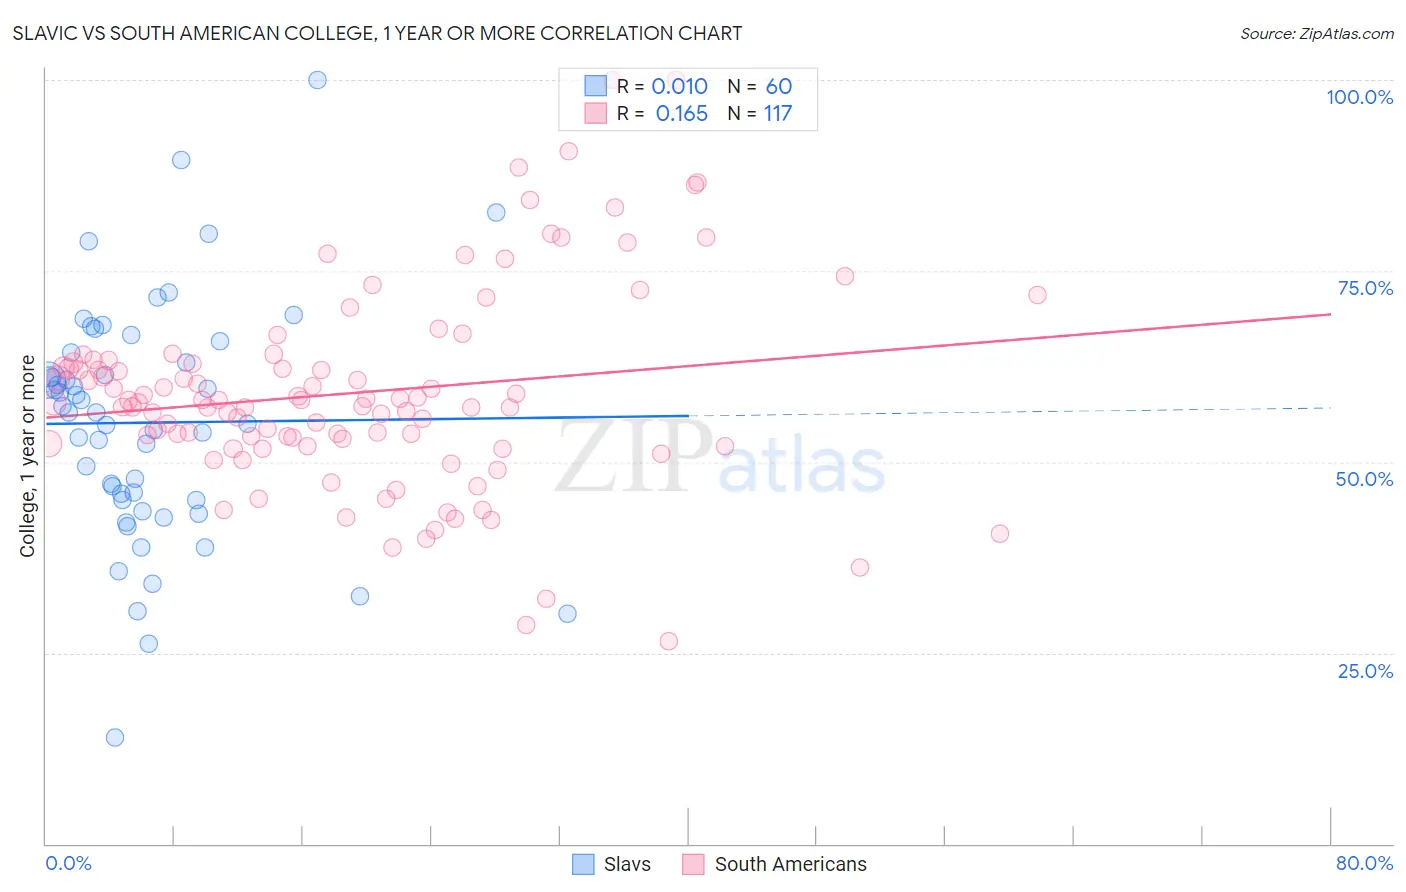
Slavic vs South American College, 1 year or more Correlation Chart
The statistical analysis conducted on geographies consisting of 270,867,316 people shows no correlation between the proportion of Slavs and percentage of population with at least college, 1 year or more education in the United States with a correlation coefficient (R) of 0.010 and weighted average of 60.6%. Similarly, the statistical analysis conducted on geographies consisting of 494,172,173 people shows a poor positive correlation between the proportion of South Americans and percentage of population with at least college, 1 year or more education in the United States with a correlation coefficient (R) of 0.165 and weighted average of 59.0%, a difference of 2.7%.
College, 1 year or more Correlation Summary
| Measurement | Slavic | South American |
| Minimum | 14.0% | 26.5% |
| Maximum | 100.0% | 100.0% |
| Range | 86.0% | 73.5% |
| Mean | 55.1% | 59.1% |
| Median | 56.5% | 57.8% |
| Interquartile 25% (IQ1) | 45.0% | 52.2% |
| Interquartile 75% (IQ3) | 63.6% | 63.1% |
| Interquartile Range (IQR) | 18.6% | 10.9% |
| Standard Deviation (Sample) | 15.6% | 13.2% |
| Standard Deviation (Population) | 15.4% | 13.2% |
Similar Demographics by College, 1 year or more
Demographics Similar to Slavs by College, 1 year or more
In terms of college, 1 year or more, the demographic groups most similar to Slavs are Czech (60.6%, a difference of 0.070%), Scottish (60.5%, a difference of 0.070%), Canadian (60.6%, a difference of 0.14%), Polish (60.7%, a difference of 0.15%), and Immigrants from Kenya (60.5%, a difference of 0.16%).
| Demographics | Rating | Rank | College, 1 year or more |
| Taiwanese | 84.3 /100 | #138 | Excellent 60.7% |
| Immigrants | Eritrea | 84.3 /100 | #139 | Excellent 60.7% |
| Iraqis | 83.3 /100 | #140 | Excellent 60.7% |
| Immigrants | Afghanistan | 83.1 /100 | #141 | Excellent 60.7% |
| Poles | 82.8 /100 | #142 | Excellent 60.7% |
| Canadians | 82.7 /100 | #143 | Excellent 60.6% |
| Czechs | 81.9 /100 | #144 | Excellent 60.6% |
| Slavs | 81.1 /100 | #145 | Excellent 60.6% |
| Scottish | 80.2 /100 | #146 | Excellent 60.5% |
| Immigrants | Kenya | 79.1 /100 | #147 | Good 60.5% |
| Kenyans | 79.0 /100 | #148 | Good 60.5% |
| Brazilians | 79.0 /100 | #149 | Good 60.5% |
| Immigrants | Sudan | 77.8 /100 | #150 | Good 60.4% |
| Albanians | 77.8 /100 | #151 | Good 60.4% |
| Immigrants | Germany | 76.1 /100 | #152 | Good 60.3% |
Demographics Similar to South Americans by College, 1 year or more
In terms of college, 1 year or more, the demographic groups most similar to South Americans are Scotch-Irish (58.9%, a difference of 0.070%), German (58.9%, a difference of 0.070%), French (58.9%, a difference of 0.090%), Spaniard (59.0%, a difference of 0.14%), and German Russian (59.1%, a difference of 0.20%).
| Demographics | Rating | Rank | College, 1 year or more |
| Czechoslovakians | 48.3 /100 | #178 | Average 59.4% |
| Bermudans | 46.6 /100 | #179 | Average 59.3% |
| Yugoslavians | 44.1 /100 | #180 | Average 59.2% |
| Swiss | 43.4 /100 | #181 | Average 59.2% |
| Immigrants | Bosnia and Herzegovina | 42.8 /100 | #182 | Average 59.2% |
| German Russians | 39.3 /100 | #183 | Fair 59.1% |
| Spaniards | 38.3 /100 | #184 | Fair 59.0% |
| South Americans | 35.9 /100 | #185 | Fair 59.0% |
| Scotch-Irish | 34.7 /100 | #186 | Fair 58.9% |
| Germans | 34.7 /100 | #187 | Fair 58.9% |
| French | 34.4 /100 | #188 | Fair 58.9% |
| Uruguayans | 31.8 /100 | #189 | Fair 58.8% |
| Immigrants | Cameroon | 31.2 /100 | #190 | Fair 58.8% |
| Immigrants | Philippines | 29.2 /100 | #191 | Fair 58.7% |
| Colombians | 27.6 /100 | #192 | Fair 58.7% |