Slavic vs Immigrants from Germany College, 1 year or more
COMPARE
Slavic
Immigrants from Germany
College, 1 year or more
College, 1 year or more Comparison
Slavs
Immigrants from Germany
60.6%
COLLEGE, 1 YEAR OR MORE
81.1/ 100
METRIC RATING
145th/ 347
METRIC RANK
60.3%
COLLEGE, 1 YEAR OR MORE
76.1/ 100
METRIC RATING
152nd/ 347
METRIC RANK
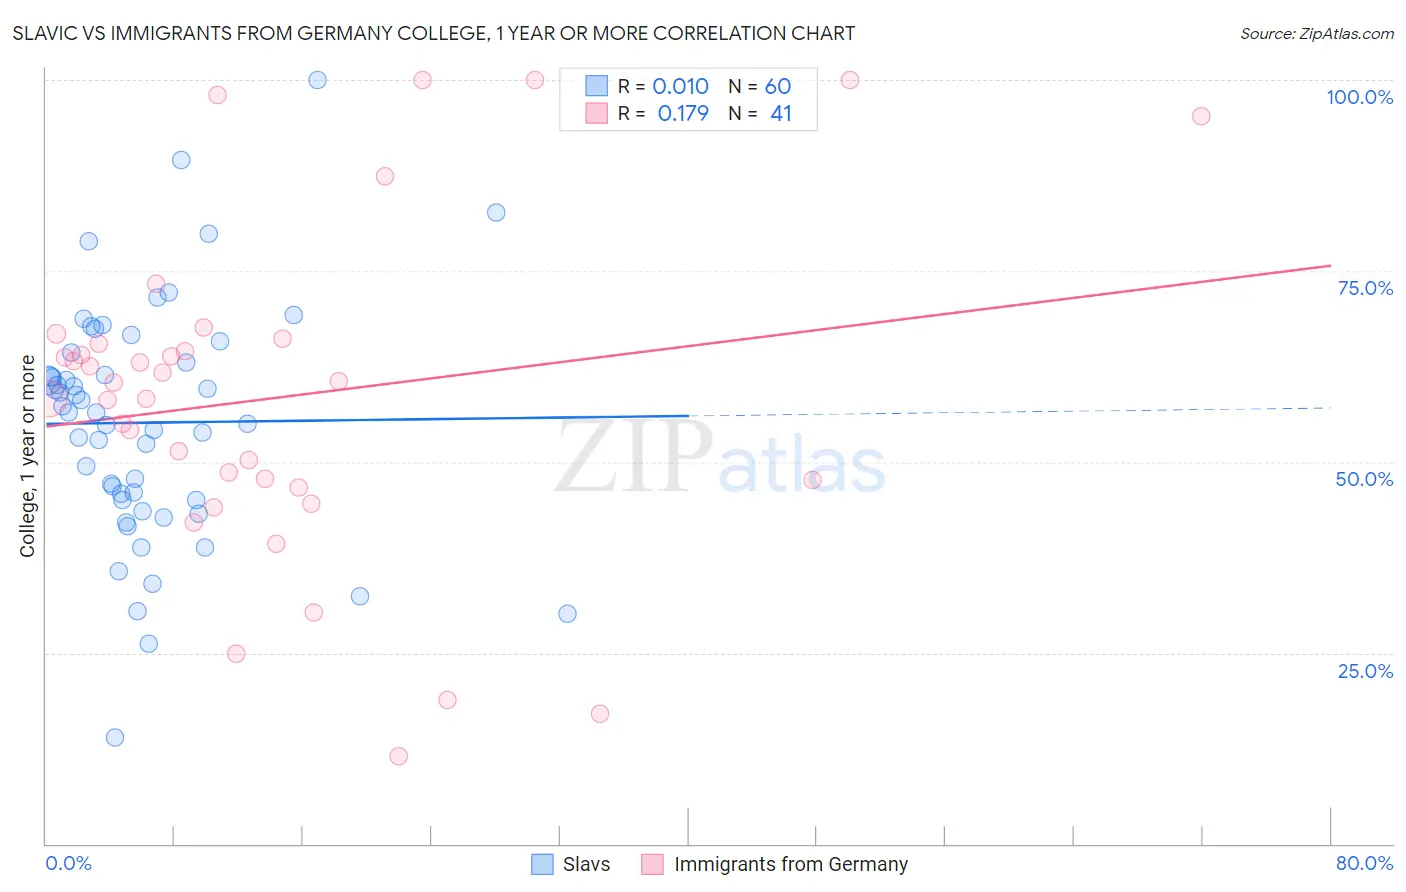
Slavic vs Immigrants from Germany College, 1 year or more Correlation Chart
The statistical analysis conducted on geographies consisting of 270,867,316 people shows no correlation between the proportion of Slavs and percentage of population with at least college, 1 year or more education in the United States with a correlation coefficient (R) of 0.010 and weighted average of 60.6%. Similarly, the statistical analysis conducted on geographies consisting of 463,883,930 people shows a poor positive correlation between the proportion of Immigrants from Germany and percentage of population with at least college, 1 year or more education in the United States with a correlation coefficient (R) of 0.179 and weighted average of 60.3%, a difference of 0.39%.
College, 1 year or more Correlation Summary
| Measurement | Slavic | Immigrants from Germany |
| Minimum | 14.0% | 11.4% |
| Maximum | 100.0% | 100.0% |
| Range | 86.0% | 88.6% |
| Mean | 55.1% | 58.4% |
| Median | 56.5% | 60.4% |
| Interquartile 25% (IQ1) | 45.0% | 47.2% |
| Interquartile 75% (IQ3) | 63.6% | 65.8% |
| Interquartile Range (IQR) | 18.6% | 18.6% |
| Standard Deviation (Sample) | 15.6% | 21.6% |
| Standard Deviation (Population) | 15.4% | 21.4% |
Demographics Similar to Slavs and Immigrants from Germany by College, 1 year or more
In terms of college, 1 year or more, the demographic groups most similar to Slavs are Czech (60.6%, a difference of 0.070%), Scottish (60.5%, a difference of 0.070%), Canadian (60.6%, a difference of 0.14%), Polish (60.7%, a difference of 0.15%), and Immigrants from Kenya (60.5%, a difference of 0.16%). Similarly, the demographic groups most similar to Immigrants from Germany are Immigrants from Sudan (60.4%, a difference of 0.13%), Albanian (60.4%, a difference of 0.13%), Sierra Leonean (60.2%, a difference of 0.14%), Kenyan (60.5%, a difference of 0.22%), and Brazilian (60.5%, a difference of 0.22%).
| Demographics | Rating | Rank | College, 1 year or more |
| Taiwanese | 84.3 /100 | #138 | Excellent 60.7% |
| Immigrants | Eritrea | 84.3 /100 | #139 | Excellent 60.7% |
| Iraqis | 83.3 /100 | #140 | Excellent 60.7% |
| Immigrants | Afghanistan | 83.1 /100 | #141 | Excellent 60.7% |
| Poles | 82.8 /100 | #142 | Excellent 60.7% |
| Canadians | 82.7 /100 | #143 | Excellent 60.6% |
| Czechs | 81.9 /100 | #144 | Excellent 60.6% |
| Slavs | 81.1 /100 | #145 | Excellent 60.6% |
| Scottish | 80.2 /100 | #146 | Excellent 60.5% |
| Immigrants | Kenya | 79.1 /100 | #147 | Good 60.5% |
| Kenyans | 79.0 /100 | #148 | Good 60.5% |
| Brazilians | 79.0 /100 | #149 | Good 60.5% |
| Immigrants | Sudan | 77.8 /100 | #150 | Good 60.4% |
| Albanians | 77.8 /100 | #151 | Good 60.4% |
| Immigrants | Germany | 76.1 /100 | #152 | Good 60.3% |
| Sierra Leoneans | 74.1 /100 | #153 | Good 60.2% |
| Sudanese | 73.0 /100 | #154 | Good 60.2% |
| Moroccans | 72.9 /100 | #155 | Good 60.2% |
| Finns | 72.9 /100 | #156 | Good 60.2% |
| Immigrants | Armenia | 68.8 /100 | #157 | Good 60.0% |
| English | 67.2 /100 | #158 | Good 60.0% |